by Peter Nicholson
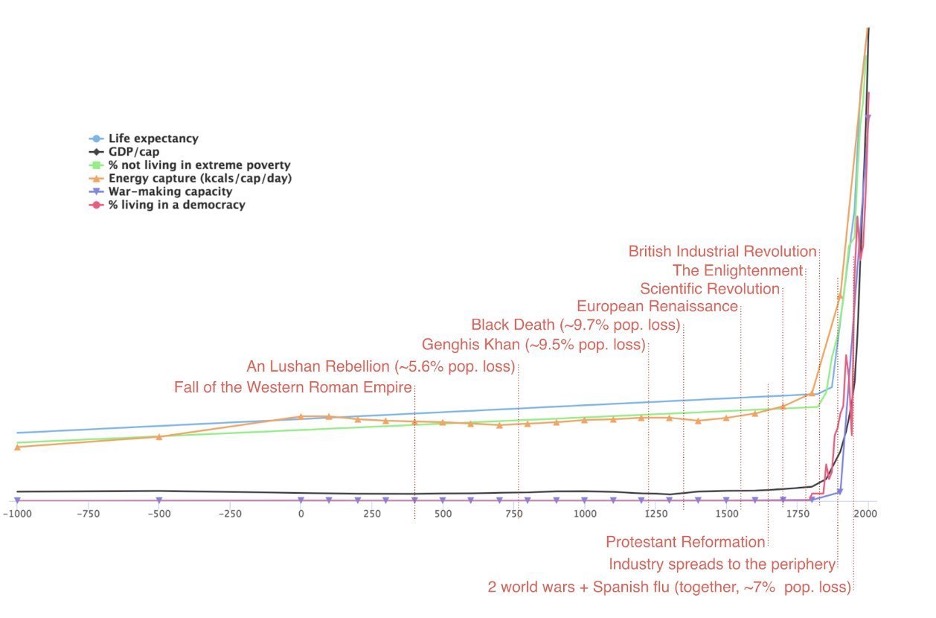
The graph below appeared in a recent post on X by Johnatan Pallesen. Although the vertical scale is not explicitly indicated, it is presumably in units appropriate to each of the six variables plotted—e.g., Life expectancy in years from zero to about 100; GDP/capita from zero to about US$70,000. The point is to illustrate the spectacular take-off in the growth of an array of relevant measures of “progress” since about the time of the first Industrial Revolution. Since the beginning of the 20th century, all of the lines have become almost vertical when contrasted with the relatively static conditions that prevailed prior to industrialization. While it has become common for social anthropologists to refer to our era, by analogy with the geological time scale, as the Anthropocene, it would be more accurate to refer to it as the “Technolocene”.
The problem with the picture above is that, when plotted on a linear scale, the exceptional growth that has occurred in the past 250 years completely dwarfs the growth processes that were taking place in the previous thousands of years. We need a way to focus on growth itself, and not on the absolute magnitude it produces over time. The technical way to do this is to plot the logarithm of an amount (say population) rather than the amount itself.
So, how does the growth story look when viewed through a logarithmic lens?
To keep things simple, let’s focus on the growth of the estimated size of the human population over the very long run. The growth of the population, at least until recently, is a good proxy for material progress. In purely ecological terms, successful populations of any life form grow until they reach some limit set by the conditions of their niche. In biology, population growth amounts to a definition of “success”. Human societies add a lot of complexity to this material notion of success, but the fact remains that population growth and most measures of technological and economic progress have until very recently been closely correlated. A second reason to focus on population is that reasonably good estimates of the human population go back a very long time—e.g., to 10000 years BC.
So as an alternative to the graph at the beginning of this note, consider the following log plot of the estimated global human population over the past 12,000 years—courtesy of William Shipley on X. [1]

The slope of the (blue) line measures the population growth rate (annual percentage increase) which clearly varies over time. Between 10000 BC and 5000 BC, the flat line indicates a roughly zero population growth rate. This would have been a Malthusian era in which more people simply led to more starvation, disease, and violence. From 5000 BC to about 1000 BC there was steady growth at about 6/100th of one percent per year. Although growth at this rate would be imperceptible to anyone living at the time, when compounded for 4,000 years it had the effect of increasing the global population from about 4 million to 50 million. As of the Christian era (year 0 in the graph when the population was about 170M), the size of the population began accelerating—the annual rate of growth began to increase exponentially. Between year 0 and the 20th C, the population growth rate went from 0.06% per year to 3-4% a year—an increase in the rate of about 50-65 times.
As the graph shows, the growth acceleration was quite smooth and the Industrial Revolution (IR) is less visible. The IR obviously represented a significant event, primarily the result of converting the energy concentrated in coal into useful work via mechanical design—e.g., the steam engine. But this epochal development is better understood as one milestone along a continuum of scientific and technological development that began 200-300 years before the Christian era but really took off sometime around 1000. Nevertheless, as you can see in the logarithmic plot, it was rocky going for the next 500 years—e.g., the Dark Ages in Europe; Black Death and other horrors in China and elsewhere. The essence of the growth-promoting power of science and technology is that it is cumulative. The innovations that drive production, medical advances, control of natural processes, etc., build off a growing base. That in turn enabled greater and greater population growth at an exponentially increasing rate.
It is evident from the preceding graph that population growth acceleration is unsustainable. Nature has a way of choking off whatever is unsustainable. In the case of population, Nature’s way was usually famine and disease and war; but now it has added declining fertility to the toolkit. (War is still an option, now that we have nuclear weapons; so is disease as COVID illustrated in a still rather benign way.) Declining fertility is dangerous in the sense that once the population ceases to replace itself, it falls exponentially. Although pro-fertility policies have had little effect in modern times, I cannot see the human race literally driving itself to extinction by an unwillingness to produce babies, although technology may eventually lead to “extracorporeal” gestation and robotic caregivers!
Even if the population eventually stabilizes, might the other growth processes illustrated at the start of this note nevertheless continue their near-vertical ascent? Suppose per capita economic output (i.e., GDP per person) were to continue to grow at just 2% annually for another hundred years, thus increasing the global average 7.2 times. This seems quite within reach. But is it likely that 2% growth will be sustained for 500 years, a span that might appear almost recent on the timescales we have been considering? Two percent growth for 500 years implies a per capita GDP that would be 20,000 times today. While technological innovation might somehow overcome the material limits to such growth, it is unlikely that the psychological motivation would persist to increase average annual consumption by 20,000 times today’s level, even accepting that a distributional revolution would eradicate significant inequality.[2] At some point, the law of diminishing returns will bring the benefit of one extra unit of consumption below the benefit of some other experience, and further material growth will diminish in priority relative to other allocations of our creative and spiritual energies.
The lesson in all this is that exponential processes are always unsustainable. And what is unsustainable must eventually find a way to stop. It’s a Law of Nature.
[1] For example, a population of 1 million is plotted as “0” on a log (base 10) scale; the next horizontal line is 2 million; then 3 million and so on. Each major unit on the vertical scale corresponds to a 10-fold increase. When you work through the math you can show that a constant rate of growth of a quantity (e.g., population growing at 3% annually) shows up as a straight upward-sloping line on a log-scale graph with an inclination proportional to the growth rate—i.e. steeper lines represent more rapid growth; a flat horizontal line implies zero growth; a downward sloping line signifies negative growth (decline), and so forth.
[2] If you may believe we could cope with a 20,000-fold increase in GDP per person (and thus also about the same multiple of consumption per person), consider 2% growth for 1,000 years—and the resulting per person GDP that is 400 million times today’s. Even billionaires like Warren Buffett still eat hamburgers at an Omaha diner.
Read more from the PolicyWonks about Social Innovation: organizations and the ongoing 21st-century transformation of society.