By Peter Nicholson
Canada’s economy has a growth problem, and the country is finally starting to notice. As Andrew Coyne recently pointed out, Canada is no longer one of the richest countries on earth. Emphasis was added by the Bank of Canada’s senior deputy governor, Carolyn Rogers, who stated in a March 26th speech that Canada’s continuing stagnant productivity growth has become an emergency, so “it’s time to break the glass.”
Indeed, it is past time for the alarm bell to be sounded. But the circumstances that have brought Canada to this point need to be viewed over a long timeframe and compared with the experience of peer countries. Only then can we distinguish the truly fundamental factors that shape economic growth in the long run from the ephemeral phenomena that dominate the business pages and the daily political narrative. This paper aims to provide the necessary broader perspective.
To that end, following are several charts comparing Canada’s economic performance, proxied by real GDP per capita, with a range of countries from 1971 through 2018. This period extends from the end of the post-war boom in the early 1970s, through “stagflation”, the neoliberal reformation (early 1980s through the Great Recession), to the year before COVID. To facilitate international comparison the data are converted to $US at Purchasing Power Parity exchange rates. The data source is the Maddison Project at the University of Groningen in the Netherlands, arguably the most rigorous source for long-run cross-country estimates of GDP. Other sources (e.g., OECD, IMF, World Bank) may differ slightly among themselves and with the Maddison data owing to different methodologies, primarily for bringing national GDP to $US (2011 constant dollars). But the trends are consistent across the standard international data sets.
The approach taken here is to compare the level of GDP per capita in country “X” with that of the US over time. If the ratio is increasing (or decreasing), it implies that per capita GDP is growing faster (or slower) in country X than in the US. The choice of the US as a global standard is reasonable because it has been the overall global economic leader for more than a century. The US represents the technological frontier in many industries. A few other countries have higher levels of per capita GDP owing to some extraordinary advantage (e.g., oil wealth in Norway and some Middle Eastern countries). Switzerland also exceeds US GDP per capita thanks to an exceptionally sophisticated industrial structure, but the US economy is about 35 times larger and includes many regional pockets richer than Switzerland. In other words, economic weight counts, as does the breadth of sectoral strength.
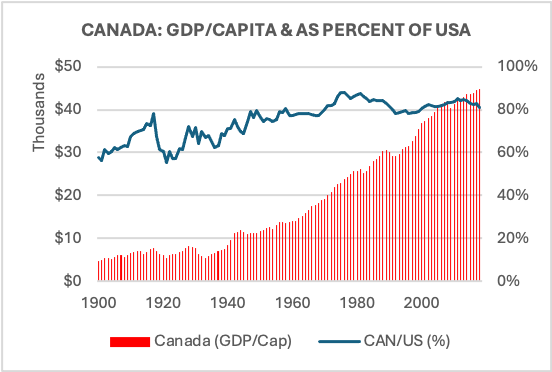
Canada versus the US: 1900-2018
Canada’s per capita GDP has averaged about 80% of the US level since the end of WWII, implying that the two countries have had about the same average growth rate for almost 75 years. Between 1900 and 1945 Canada was generally growing faster than the US but has been unable to close the 20% “gap” in the relative level of GDP per capita ever since. From 1970 through 2018, Canada’s per capita GDP has ranged between a high of 88% of the US level (1975) and a low of 78% (1996). Although the chart extends only to 2018, Canada has since fallen below the 78% mark as US growth has recovered more strongly since COVID.
The message in the chart is that Canada’s economic performance, as proxied by the growth of real GDP per capita, has closely mirrored that of the US with fluctuations (that may extend over many years) in the relative level of GDP around the 80% average. Quantitative theories of long-term growth predict that countries that share close economic ties in the form of trade, investment, and exchange of people and information will tend to converge onto a stable long-term growth path at a common average rate of growth. Canada and the US illustrate the phenomenon. But while growth rates may converge, the level of GDP per capita may not. In level terms, Canada remains stuck about 20% behind the US. Why? Because the US is the innovation leader in most sectors, it will be the first to exploit the new economic opportunities while Canada (and others) usually adopt leading-edge technologies and business practices with a lag.[1] During the time that current US innovation is diffusing broadly, the US economy continues moving on to the next stage, thus maintaining its relative position at the head of the pack.[2]
The OECD “Growth Peloton”
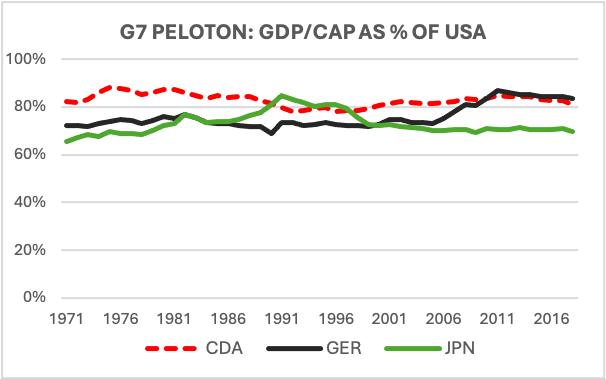
Canada’s experience relative to the US is shared by most other advanced countries—i.e., they grow GDP per capita at about the same average rate and lag the level of US per capita GDP by 10% to 25%. In terms of growth rates, the economically advanced countries are bunched together like the riders at the head of a bicycle race—i.e. the peloton. The chart plots GDP per capita (1971-2018) as a percent of the US level only for Canada, Germany, and Japan but the long-term pattern is common to most of the advanced OECD countries. The relatively flat lines—i.e., a roughly constant percent of US per capita GDP—imply approximately equal growth rates among the US, Canada, Germany, and Japan punctuated by periods when a given country grows faster (slower) than the US for a number of years. For example, visible in Japan’s rising trend line during the 1980s is a decade of very rapid growth followed by relative stagnation from 1991 through 2000 (the falling line). Also evident is Canada’s relative growth slump throughout the 1980s due to comparatively weak productivity growth. From the late 1990s through 2013, Canada outgrew the US on average, as very strong job growth more than offset continued weak productivity increase. Since then, Canada’s average annual rate of employment growth has slowed relative to the US while relative productivity has not picked up to compensate. Thus Canada’s per capita GDP declined from 85.4% of the US level in 2013 to 81.1% in 2018 and has fallen further since (see below).
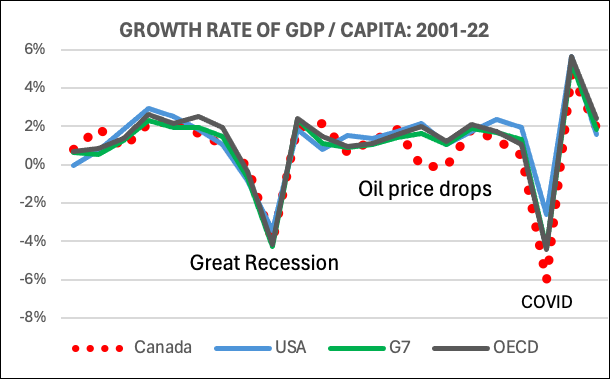
The remarkably tight synchronization of growth rates can also be seen directly in the graph below that traces the annual percentage change in real GDP per capita (2001-22) for Canada, US, G7, and the OECD total. Canada’s rate is more volatile than the larger aggregates’ and more dependent on resource prices.
The synchronization of growth rates of the economically advanced countries is certainly not a Law of Nature. Rather, it depends on the interchange of technology and knowhow via various channels—e.g., cross-border investment, trade, communications, and movement of people—all in the context of national institutions that maintain conditions that support economic performance—education, rule of law, competition, property rights, and reasonable equality of opportunity. Democratic politics may not be necessary, at least in the short to mid-term, but autocratic systems are vulnerable to corruption and inequality that eventually undermine economic performance.
Some Implications for Canada
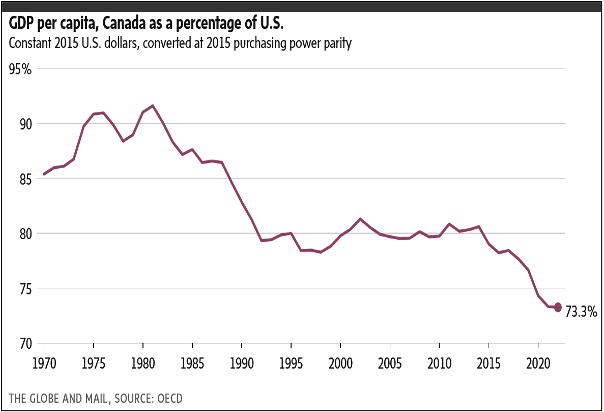
There is a risk of drawing the wrong conclusion from the long-run equality of growth rates. It is not inevitable that a country that is currently in the peloton will continue to grow with the pack. A country needs to sustain the above-noted conditions of membership. In other words, it must keep “pedaling” hard and make adjustments if adverse economic conditions knock it off the shared growth path. For example, Canada has been experiencing an extended period of slow growth relative to the US since the end of the boom in oil prices in 2014, with GDP per capita as a percentage of the US declining from 80.6% to 73.3% in 2022. Clearly, this is a strong signal that Canada—more specifically, Canadian business—needs to adjust.
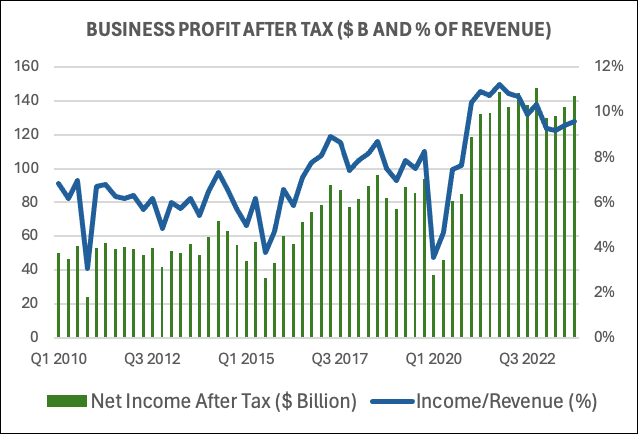
But the incentive to adjust has been mitigated by the robust profitability of Canadian business overall (Source: StatCan Table 33-10-0224-01). If the results in the chart below can be achieved despite a weak commitment to investment in machinery and equipment (M&E) and R&D and other intellectual property products, then why take the risk? The answer is that a failure to stay close to the leading edge of innovation, investment, and business practices—the result of which is weak productivity growth—will eventually show up in a reversal of the trend of profitability. But until that day arrives, Canadian business, on the whole, will be reluctant to abandon the “low-innovation” strategy that has served it well for the past 75 years or more.
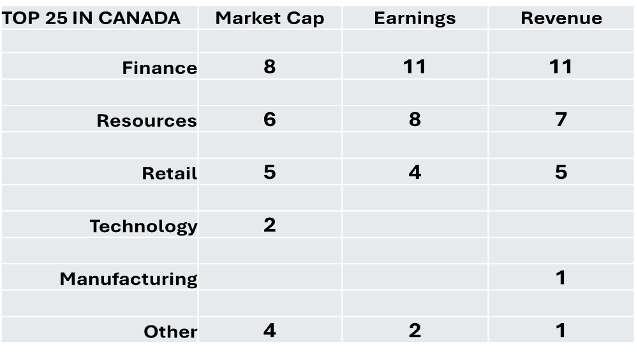
Canada’s industrial structure largely explains its weak showing on most global metrics of innovation. The largest companies according to financial metrics belong to traditional economic sectors, dominated by finance (banking and insurance) and resources (primarily energy). Only two of the current top 25 companies by market value are in information technology (Shopify and Constellation Software) and only one manufacturer (Magna) makes the top 25 in revenue. The “Other” category in the table includes CN and CP, Thompson-Reuters, and Brookfield. A ranking by the Boston Consulting Group of the world’s 50 most innovative companies in 2023 contained none from Canada. Seventy percent of the 50 were in information and communications technology, advanced manufacturing, and pharma, sectors that account for the great majority of business R&D and patenting. Canada has an encouraging crop of small and medium-sized companies in these sectors, but it will take time to grow them to a scale that can have significant impact on the national economic aggregates. In the meantime, businesses in the traditional sectors will be increasingly challenged to invest heavily in the latest M&E and intellectual property products and to adopt/adapt innovation and best practices from around the world. These actions will be needed to sustain the bottom line and, while doing so, will also turn around Canada’s relatively weak productivity performance. Or so we hope.
A Broader International Perspective
The analysis to this point has focused on Canada’s performance relative to the US which is appropriate given the integration of the two economies and their geographic and social adjacency. That said, the two economies are of vastly different scale and industrial structure, with the US being in a class by itself. Comparison of Canada with a broader group is therefore instructive. It is still relevant to plot the level of GDP per capita relative to the US as the global comparator. The following charts cover the period 1971-2018 during which Canada fluctuated in a narrow band around 80% of US GDP per capita.
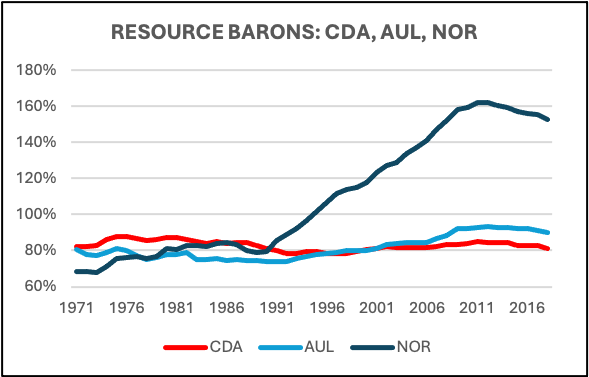
Canada’s relative trajectory has been approximately mirrored by Australia’s, although since the early 1990s Australia has benefited particularly from China’s voracious demand for raw resources. Meanwhile, the other advanced but resource-heavy economy in the OECD, Norway, has converted North Sea oil into exceptional national wealth. The challenge facing all three countries is to sustain growth in the face of the anticipated eventual decline of the fossil energy sector. Canada and Australia have great potential to supply the so-called critical minerals that will be needed to support both the green economy and the infotech sectors. And Norway has abundant clean energy with which to attract energy-intensive industries, as well as the capital resources to develop them at global scale.
The chart opposite compares four countries that, together with the US, are widely viewed as innovation leaders. Apart from Switzerland, which is exceptionally specialized in high-value industries, Germany, Japan, and Sweden all track at about 80% of US per capita GDP, roughly the same as Canada. And even innovation juggernaut Switzerland has grown at the same rate as the others except for an exceptional spurt between 2000 and 2011 (as had Germany). These countries that feature leading innovation indicators—e.g., business R&D and technology-intensive exports—tend to have a high level of labour productivity but lower labour utilization (hours worked per capita) than Canada and Australia. The two factors net out to similar levels of GDP per capita.[3] The problem for Canada is that growth of the employment-to-population ratio is fundamentally limited by demographic and participation rate factors. Productivity growth is the only durable source of per capita GDP growth.[4]
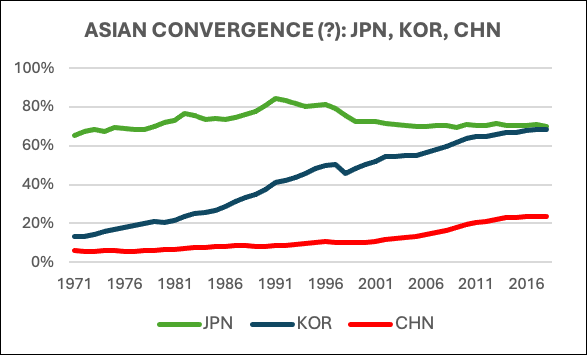
The nexus of global growth is Asia owing to the sheer weight of population combined with a commitment to education and investment. This is illustrated by the remarkable growth of South Korea from 13% of US per capita GDP in 1971 to almost 70% in less than 50 years. Taiwan, Singapore, and Hong Kong—the Asian Tigers celebrated in the 1990s—have followed essentially the same trajectory, bringing them into the peloton of the most developed countries.[5] China appeared to be on track to join the peloton within a few decades although its growth rate has since moderated to little more than the US rate. It remains to be seen whether this is a temporary pullback from an unsustainable pace driven by excess investment in certain sectors, notably real estate, or perhaps it’s a fundamental slowdown caused by demographic and political factors. Nevertheless, China is assured of enormous economic and geopolitical influence by virtue of its population and world-leading capability in many sectors.
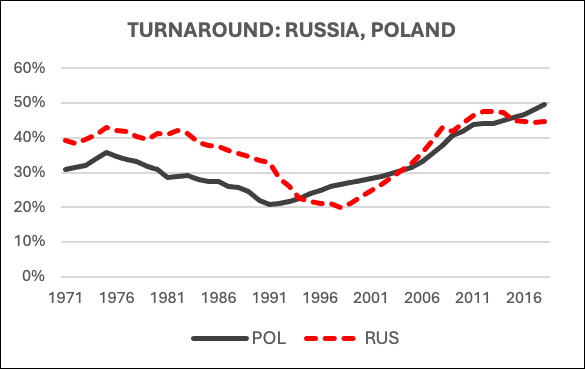
Countries in the former Soviet bloc have recovered strongly since the dissolution of the USSR in 1991. Poland’s growth has been particularly impressive and is on a track comparable to that of South Korea, although beginning 20 years later. Russia’s turnaround was delayed but growth recovered rapidly before flattening after oil prices declined sharply in 2014. The invasion of Ukraine (which is beyond the range of the chart) and chronically dysfunctional Russian politics make the economic future of Russia and bordering countries in Eastern Europe—eleven of which are members of the EU—highly uncertain. With vast potential for resource-based wealth, Russia faces many opportunities and challenges similar to those confronting Canada, particularly related to the future development of critical minerals and the longer-term prospects of fossil energy.
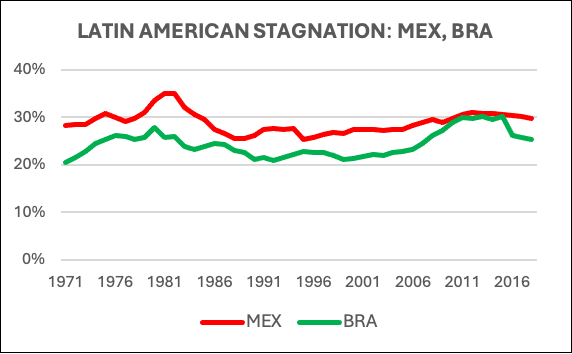
By contrast with countries like Korea and Taiwan, no Latin American nation has been able to sustain for several decades the high level of growth needed to join the advanced economy peloton. This is puzzling in view of the close relationship between the US and Mexico on the one hand, and the enormous resource wealth and intellectual resources in Brazil on the other. In each case, chronically dysfunctional politics appears to be the root cause. Although both Brazil and Mexico have grown on average at about the same rate as the US between 1975 and 2018, their relative GDP per capita has remained mired between 25% and 30% of the US level. They are stuck in a low-income rut characterized by an exceptionally high degree of income and wealth inequality that is unfortunately also typical of virtually all countries in Latin America and Africa and many in the Middle East and Asia. While dysfunctional politics is a common characteristic, this only begs the question as to whether rotten politics is the cause or consequence of chronic underdevelopment. And why does political dysfunction persist indefinitely in some societies, preventing the kind of catch-up growth spurt experienced by Korea and Taiwan starting in the 1950s, and also by Canada between the late 19th and mid-20th centuries?[6]
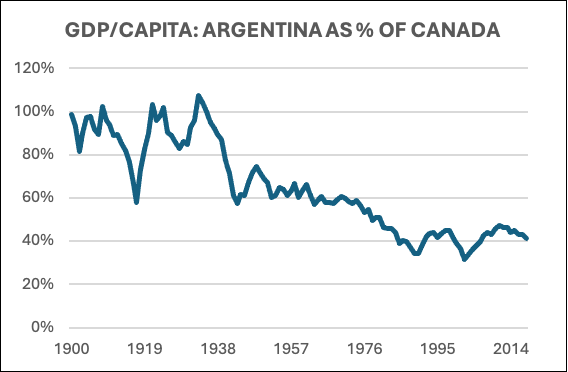
Argentina provides a cautionary tale—a resource-rich, multi-ethnic country, with a rich cultural tradition—which until the 1930s had a per capita GDP roughly equal to Canada’s. Then the wheels fell off and have never been re-attached. How did political dysfunction become embedded for more than 80 years and counting? What negative feedback loops have caused the situation to persist?
Could it happen here?
[1] If the level of GDP/Cap in Country B is, say, 20% below that of Country A today we may also think of Country B as being several years behind Country A. For example, at a growth rate of 2%, it would take Country B a little more than 11 years to reach the level of Country A’s GDP/Cap today.
[2] Economic hegemony is never guaranteed to continue. The US eventually overtook hegemonic Britain in the late 19th century. Nevertheless, economic leadership usually endures for long periods.
[3] Japan’s per capita GDP has lagged its peers for the past 20 years, due to a combination of comparatively low labour productivity and a low employment-to-population ratio. The latter is due to ageing demographics, while the low productivity level reflects the large number of jobs in several protected, traditional sectors. Japan’s export sectors have maintained high productivity to ensure international competitiveness.
[4] The rate of growth of GDP per capita is by definition the rate of growth of GDP per hour worked (labour productivity) plus the rate of growth of hours worked per capita (the employment ratio based on the total population). The growth of the ratio is fundamentally limited by demographics and hours worked per person and is likely to turn negative as Canada’s population ages. Per capita growth will therefore likely depend entirely on productivity growth.
[5] The same has not been the case for the Philippines despite its long-standing ties with the US. Chronic political dysfunction has been the culprit. Recently, several Asian countries, like Indonesia and Vietnam, that did not take off when Korea and Taiwan did, now appear to be on a growth path that could eventually bring them into the peloton.
[6] In 1900, Canada’s per capita GDP was only 56% of that of the US, but by 1948 it had reached more than 76%. On average, but with wide fluctuations, Canada’s per capita growth rate exceeded that of the US by almost 7/10th of a percentage point for 50 years. Since then, their average growth rates have remained approximately equal and with smaller relative fluctuations.