An analysis of public service employment trends: 2010-23
By Peter Nicholson
Since Justin Trudeau became Prime Minister in 2015 almost 100 thousand (net) new employees have been added to the federal public service, an increase of nearly 40% in eight years. The growth in 2023 alone numbered some 21,000 or 6.3%.[1] The significant increase has begun to attract media attention, notably a recent article in the Globe & Mail: “Size of federal public service swells to record high.” The related steep growth in personnel expenditure—from $44B in FY 2019-20 to $61B in 2021-22—was the subject of an April, 2023 analysis by the Parliamentary Budget Office.[2]
While these growth figures raise headline questions regarding the size of the public service, they need to be interpreted in light of the policy objectives of the government of the day as well as factors affecting the efficiency with which the government’s agenda is implemented. The appropriate size of the federal public service can only be assessed in this context.
The purpose of this paper is to delve into the employment data at the departmental and agency level and over the period 2010-23, covering the trends during the last five years of the Harper government (2010-15) and the Trudeau government to date (2015-23). After a short introduction to set the scene, the paper addresses the following questions:
- What factors may be driving the rapid growth of the public service since 2015?
- Is the federal public service too big and according to what criteria?
A concluding section summarizes the paper’s answer to the 2nd question.
The analysis is supplemented by three Annexes that comprise a series of tables and charts tracking the evolution of public service employment in almost 60 departments and agencies, grouped into 15 “portfolios” that account for more than 98% of total employment. Annex A summarizes, in a comparative context, the employment trends during the Harper and Trudeau governments, illustrating starkly different policy priorities. Annex B presents in graphical form and at the individual departmental and agency levels the evolution of public service headcount 2010-2023. Annex C contains the full data set.
Setting the scene
Public attention tends to focus on government spending, not on public service headcount. But apart from unusual spikes in expenditure associated with events like COVID and severe recessions, spending and headcount are closely correlated. The evolution of public service employment is therefore an indicator of the evolution of government priorities.
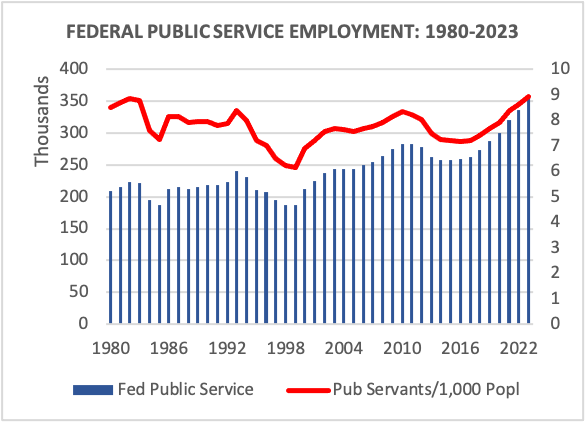
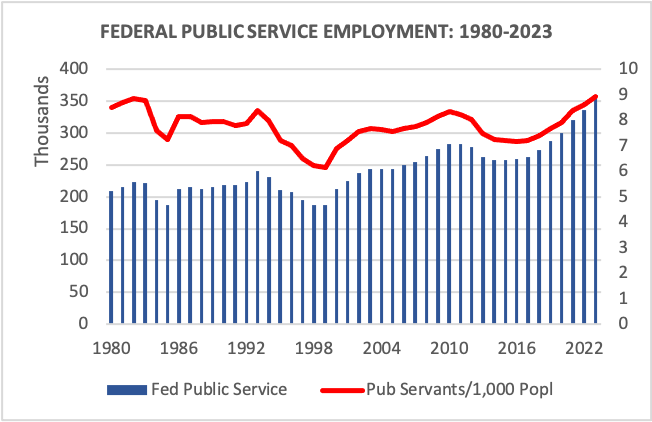
In 1993 the federal public service numbered 240,500. By 1998, following the fiscal retrenchment initiated in the 1995 budget, headcount had fallen 22% to 187,000. But by the beginning of the Harper government in 2006, employment had recovered to 250,000 and continued to increase to 283,000 in 2010. By the end of the Harper regime in 2015, following a period of relative austerity, employment had declined by 26,000 (9.2%) to 257,000. But by March 31, 2023, it had rebounded strongly to more than 357,000. To put these numbers in context, between 2015 and 2023 the federal public service grew almost four times as rapidly as Canada’s population during which time the number of federal public servants per 1,000 population increased from 7.2 to 8.9. The 39% growth of the federal public service significantly outpaced: the 14.9% (real) growth of the economy; the 12.6% growth of total employment; and the 24.5% growth of employment at all levels of government in Canada. On the other hand, federal public service growth was far less than the growth of program spending (74.9%) and of federal operating expenditures (up 75.2%). The latter refers to the overall cost of running the government, more than half of which is currently public service compensation.  For example, in FY2022-23, total federal program spending was $439 B, of which $309 B (70%) consisted of transfer payments to individuals, groups, and other governments, while $130 B covered the cost of the government’s own operations, including employee compensation of $67 B (52% of operating expense and 15% of total program spending). Clearly, the size of the government workforce accounts for significant annual expenditure.
But can the recent growth be considered excessive? Or has Prime Minister Trudeau simply restored public service strength from a depleted level at the end of the Harper regime?
Over the entire 2010-23 period being examined, net federal public service employment increased by almost 75,000, representing an average annual growth rate of 1.8% compared with 1.2% for the national population. Of course, there is no reason to expect the growth of the civil service to match, much less exceed, population growth. Other things being equal, we would hope that increased productivity—e.g., through investment in information technology, better work processes, and management training—would bring public service growth below that of the population, particularly as so much specialized and urgent work is being outsourced to consultants.[3]
The robust public service growth over the last eight years, and especially the dramatic 6.3% increase in the most recent fiscal year, call out for explanation and justification.
Principal Factors that Determine the Growth of the Federal Public Service
What are the principal factors that drive growth in the size of the public service and those that might inhibit growth? The actual trajectory will depend on a dynamic balance between the two—a balance that will shift according to a changing mix of external and political influences.
The 39% growth since 2015 appears to be due principally to some combination of the following four factors.
- The ambition and philosophy of the Trudeau government: The government came into office at a time when the neoliberal paradigm[4], which had held sway in most of the economically advanced countries since the early 1980s, was being widely questioned in light of income inequality, the severe recession of 2008-09, and a weakening trend of economic growth. A new consensus has been developing in most Western governments in response to the view that the ideological pendulum has swung too far. It was seen as time to “bring government back,” and particularly the social agenda of government. In the Trudeau government’s case, this has featured the creation or expansion of many inherently labour-intensive programs. This coincided with a major cultural revolution—the Diversity, Equity, and Inclusion movement, which in Canada has been amplified by a historic commitment to Indigenous reconciliation. Every federal department and agency has committed to promoting DEI and reconciliation in hiring practices and human resources management. The combined effect of all the foregoing trends has been to put strong upward pressure on staffing to accommodate the new priorities.
- The COVID pandemic: This unanticipated external shock—analogous in many ways to a declaration of war—required a large and rapid mobilization of government effort to implement extraordinary financial assistance, new public health capacity, extra border security, and many other adaptations to the unprecedented circumstances. Between FY 2018-19 and 2020-21 program spending increased by $294 B (93%). Partly to cope, the public service headcount increased by 46,000 (17%) between 2018 and 2021. While program spending had come down 28% ($170 B) by FY 2022-23, the size of the public service has continued to grow—up 12% (38,000) between 2021 and 2023 for reasons that will be addressed later.
- Political and bureaucratic incentives: Politicians and senior bureaucrats are a constant source of new policy and program ideas with associated staffing implications. In a recent letter to the Clerk of the Privy Council, the outgoing Chief Information Officer, Catherine Luelo, observed that departments “have not met an idea they don’t like,” and are always creating new standalone programs—e.g., to implement about 700 commitments in ministers’ mandate letters.[5] At the same time, the incentives to kill existing programs are much weaker. That’s because every program develops a constituency of beneficiaries, including the bureaucrats who manage the program and the external consultants who may be called on periodically to evaluate it! There is thus an inbuilt tendency for the program portfolio (and its public service cadre) to grow cumulatively and become more and more complex and fragmented. Moreover, a belief in the mystical power of information technology encourages politicians to call for programs whose design and complex eligibility features put increasing pressure on stressed legacy IT systems and require new hires, and a growing army of consultants, to fill the gaps. More generally, the labour relations environment in the heavily unionized public service, and the quasi-tenured position of more senior members, also serve to promote cumulative headcount growth—i.e., easier to hire than to fire.
- High-profile service disruption/degradation: Any significant degradation of critical customer-facing services creates a strong political incentive to fix the problem, pronto—e.g., the problems in border services and passport issuance as travel rebounded after the pandemic—and this means hiring people. But while occasional service fiascos attract a lot of media attention, they appear to be relatively small contributors to overall headcount growth. The big drivers of staff growth are associated with the introduction or expansion of programs that require complex eligibility assessment and other labour-intensive administrative features.
There are two principal factors, present in every government, that constrain the otherwise untrammelled growth of the public service.
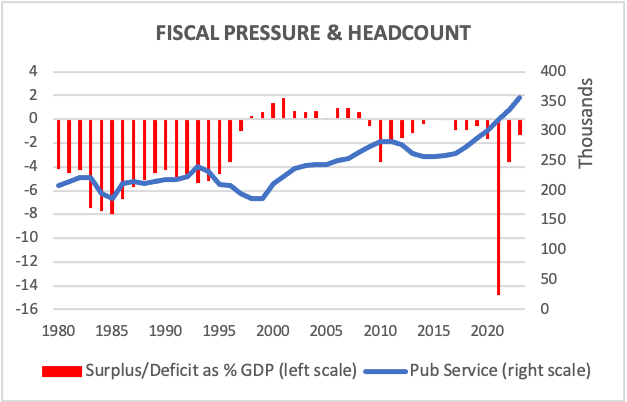 Fiscal discipline: Because there is always resistance to taxes, the fiscal constraint on public service headcount is potentially powerful. And while governments can resort to borrowing, this too is ultimately constrained to maintain acceptable debt ratios. In response to several episodes of fiscal pressure, as illustrated in the chart, the federal public service has seen three multi-year reductions in headcount over the last 40 years—FY 1982-83 through 1984-85; 1993-94 through 1998-99; and 2010-11 through 2014-15. Prime Minister Trudeau was fortunate that extremely low interest rates (prior to the recent inflation), and a moderate ratio of federal debt to GDP permitted the government to run relatively large deficits without generating much concern in either financial markets or the general public. Thus there was very little focused fiscal constraint on public service growth until recently.
- Productivity: If the government is able to provide its services more efficiently it can fulfill its various missions with fewer public servants than would otherwise be the case. Productivity growth—doing more with less—is a win-win proposition and is the ultimate source of an increasing average standard of living.[6] Growing labour productivity (output per employee) can be achieved in both the private and public sectors through investment in technology and capital equipment; better management practices; and through recruitment and training of motivated people. In other words, productivity grows by working smarter. Unfortunately, public service productivity is inherently difficult to measure because the value of output is rarely determined in the market of dollars and cents, or in any tangible, measurable amount other than program spending. But just because public service productivity is hard to measure does not mean that it is not important and that it cannot be made to grow steadily. In the private sector, the incentive is provided by market competition. But in the public sector, the incentive to improve productivity must come from political leadership that transmits the mission to senior bureaucrats and on down through the ranks. The problem is that the political motivation may be weak in view of the relatively low profile of the public service and the risk of high-profile screw-ups when new (potentially) productivity-enhancing technology is introduced.
Both the Harper and Trudeau governments have stated a commitment to more efficient delivery of both internal and external services. For example, the headcount of Shared Services Canada—the government’s internal IT services organization—has grown rapidly as has spending on IT out-sourcing, although sometimes with disastrous consequences—e.g., Phoenix, ArriveCan. More effort is nevertheless required including to increase the professional competence of internal IT hires, admittedly a challenge given compensation and other bureaucratic constraints. In view of the obvious importance of attracting, training, and retaining top-notch people, it appears odd that the two agencies ostensibly responsible internally for management training (Canada School of Public Service), and for quality recruitment and career development (Public Service Commission) have languished, at least in terms of staff complement and budget.[7]
Is the Federal Public Service Too Big?
The answer to the question as to whether the federal public service is currently too big is obviously related to one’s view of the role of government—do we want government and the public service to do more or to do less? Nevertheless, looking at the 39% growth of headcount since 2015 there are some objective reasons to suspect that the size of the public service is now greater than it would need to be to implement the policy and program objectives of the Trudeau government. Why?
- The fiscal constraint on the growth of the public service was of little concern during the period of exceptionally low-interest rates on public borrowing. (Government of Canada long-term bond yields hovered between 1% and 2.5% between 2015 and 2021.) Under these conditions, it would be expected that less effort would be given to keeping public service growth to the minimum needed to provide quality services. The government’s priorities lay elsewhere.
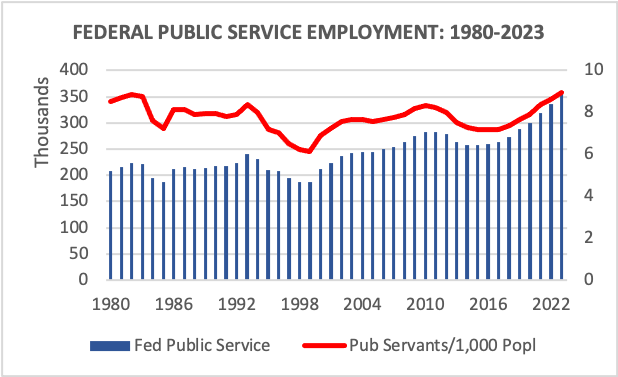 The number of federal public servants per 1,000 population (the red line in the chart) reached 8.9 in 2023. This marked the highest ratio in at least the past 40 years during which governments of various ideological stripes have held power.
- Headcount continued to increase strongly in the aftermath of the pandemic build-up—increasing 5.1% in 2022 and 6.3% in 2023, even as total program spending declined by 28% between FY 2020-21 and 2022-23.[8] But as explained later, some of this growth was needed to clean up the effects on existing programs of COVID-19 spending and is planned to be temporary.
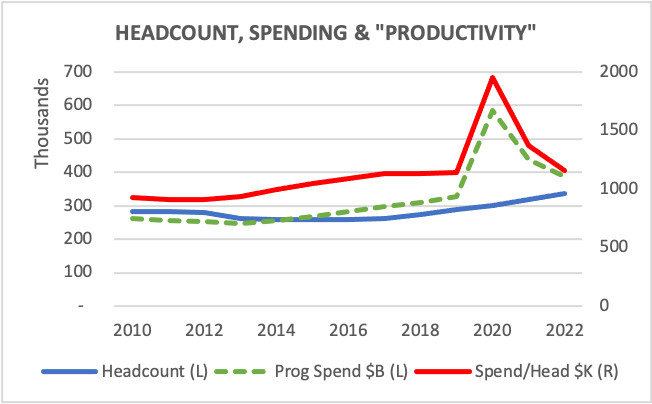
The foregoing bullet points provide circumstantial evidence, but not proof, that the federal public service has grown by more than necessary to deliver the government’s overall program. A different perspective on public service headcount is provided in the chart on the next page which traces inflation-adjusted (“real”) program spending per public servant. To the extent that real program spending can be regarded as a very rough proxy for the output of the federal government, then spending per public servant would be a proxy for public service labour productivity. Stagnant productivity would then be evidence that it was taking more public servants than necessary to achieve the government’s objectives. In that sense one could conclude that the public service was “too big”.
So, what do the productivity trends since 2010 tell us?
During 2011-15, the Harper government cut headcount more rapidly than program spending, so public sector labour productivity (spending per full-time-equivalent employee) grew at an average rate of 3.6%,
as indicated by the upward-sloping red line in the chart. [In the chart, the lower blue line traces headcount (left scale); the dotted green line is (real) federal program spending (left scale);[9] and the upper red line is program spending per public servant—e.g. $1.16 M in 2022-23 (right scale).]
 But it turned out that many of the staff cuts made during Harper’s Deficit Reduction Action Plan (DRAP) were not sustainable. Rather than cutting popular programs, DRAP emphasized headcount reduction in the hope that efficiency gains would emerge. For the most part they did not—e.g., the significant rise in immigration processing backlogs to cite one of several examples. The result was generally reduced program integrity which required headcount growth early in the Trudeau government to correct. In other words, the apparent productivity surge in the latter Harper years was largely illusory in the sense that it was not sustainable.
The onset of COVID, and the associated spike in program spending in 2019-20, caused a dramatic increase in apparent public service labour productivity. But this too is an illusion. The COVID-emergency payments were able to be made largely with existing staff and procedures, causing spending per employee to peak. But in the aftermath, very large numbers of new employees had to be hired to clean up distortions created by the COVID spending measures—e.g., to determine EI entitlements in the context of CERB payments. Thus as spending plummeted post-COVID, headcount actually increased causing “productivity” to crater. The net result is that from 2016-17 through 2022-23 real program spending per public servant was essentially flat. By this measure there was no labour productivity increase at all.[10] On the other hand, based on current departmental plans, many of those hired to “clean up” after COVID will be let go, as will staff associated with sunsetting programs.[11] Other things being equal, this will generate increased productivity at least in the short term. But other things are never equal, so planned spending and staffing beyond the very short run need to be regarded cautiously.
While it is likely that political leadership has accorded too little priority to increasing the efficiency of government, a point recently emphasized by Kevin Lynch and Jim Mitchell, we may still ask:
(a) Is the recent growth in headcount due primarily to a lack of adequate bureaucratic control bred of fiscal complacency? or
(b) Is the growth driven largely by the government’s adoption of overly complex rules regarding program implementation, all in the context of inadequate technological systems?
If the answer to either question is “Yes” then we can conclude that the public service is too big—i.e., it is bigger than it needs to be to deliver what the government of the day seeks to accomplish. But the implications for solution are quite different. The remedy in the case of (a) is the traditional nostrum of finance ministries everywhere—conduct expenditure and program reviews, identify the fat and activities of low priority, and wield the fiscal scalpel (or axe). That was the Harper government’s approach and, as noted earlier, the cuts were not sustainable because the hoped for productivity gains did not materialize.
In the case of the Trudeau government, question (b) appears to be the more relevant, although fiscal complacency has also been in the mix. The present government increased spending dramatically (quite apart from COVID) in several social policy domains. As a result, transfers to individuals and groups increased by 85% between FY 2015-16 and 2022-23 by which time COVID transfer spending had ended.[12] Most of these programs come with elaborate qualification criteria and are therefore labour-intensive to implement.[13]
The productivity killers are to be found in the transfer and granting programs other than the major transfers to governments. As the examples in the text box (next page) illustrate, the government’s particular spending and regulatory choices, with a heavy bias to those that are labour-intensive, have been major drivers of the rapid headcount growth.
The objective should be to implement the government’s agenda as determined by political commitments and legislated requirements as efficiently as possible. As a practical matter this involves some combination of (i) simplifying program criteria, eligibility rules, and internal compliance procedures, and (ii) becoming more sophisticated and proficient in the use of technology to automate delivery processes.
The first solution component (i) will often involve a trade-off between requiring complex eligibility criteria in order to tightly target spending versus simpler criteria that are cheaper to implement but result in some “wasted” spending beyond the target purpose. The main way to mitigate the trade-off—i.e., to have tightly-targeted programs without excessive headcount requirements—is to invest heavily in sophisticated information technology and in hiring and training for its efficient use. Nevertheless, as the EI example in the text box below illustrates, some rules are impossible to automate even with state-of-the-art technology so a trade-off is sometimes unavoidable. There are other situations where the problem could be avoided altogether. For example, when the government was deciding how to deliver its new dental benefits program it could have chosen to delegate the back-office processes to the Provinces that already had systems in place to handle the benefit delivery at low incremental cost. But the government chose not to, and added to its own headcount and cost instead. Finally; multiple financial tracking and reporting systems appear to be significant generators of head count, usually in response to some “boondoggle”. Redundant, overbearing compliance mechanisms, ostensibly to ensure taxpayers’ money is being spent as intended, end up imposing significant (if unquantified) costs on both the users and deliverers of programs. Accountability imposes costs as well as benefits so attention is needed to ensure the latter exceeds the former.
How Program Design Complexity Increases Staffing Requirements
[The following content is based on an interview with a senior official with direct knowledge of the issues.]

Canada has probably the most complex rule sets in the world that govern the delivery of transfers to individuals--famously around EI. Here is just one example. If you are laid off, you cannot collect EI during the period you are receiving severance pay from your company. Although this sounds straightforward, it turns out there are some 130 types of payments individuals might receive upon departing a company (e.g. vacation pay). You are allowed to receive most of these while still eligible for EI.  The catch is that most companies don’t track the precise type of severance payment. The EI system requires a human being to call the company to identify the precise type of payment. Several hundred (full-time-equivalent) employees are occupied with the task.  But when the CERB was introduced, the surge in EI applicants made it infeasible to make all the calls to determine eligibility. So the rule was temporarily suspended and as a result claims were processed in hours, not weeks.  But when the crisis passed, the rule was reinstated on the fiscally-motivated ground that EI payments had to be administered in strict adherence to the severance eligibility rule despite the degradation of service and increase of headcount this implied.

The rules around immigration provide many other instances of extreme complexity. For example, there are five separate refugee systems with different rules for different groups--Ukrainians, Afghanis, Syrians, etc. The rules are so complex that there is no option but to deploy significant human resources to manage.

The present government has made the rules in multiple areas extremely complex and has done so done with full awareness of the implications for the added staffing requirements.
The fundamental solution to lagging productivity—and to “right-sizing” the public service—is to become more sophisticated and proficient in the use of technology to automate program delivery processes. That job is of course also made easier if the rules are less complex and if the federal government does not choose to deliver itself what other governments in Canada are already set up to deliver.[14]
Unfortunately, experience has shown that the introduction of information technology in large public bureaucracies is a fraught process where failures are expensive and politically embarrassing. There is an incentive to try to play it safe and hope that legacy systems can hold up. But the answer is not to shy away, but rather to double down on the commitment to efficiency and to invest in developing far greater internal expertise to guide and complement the still necessary use of external consultants. While this would increase headcount in the near term, the payoff would be to reduce the number of public servants needed to deliver any given level of service.[15]
Successive governments have talked a good game, most recently with the launch in 2022 of Digital Ambition, a government-wide strategy to guide the delivery of government in a digital age. In December 2023, the government’s Chief Information Officer, Catherine Luelo, resigned after two and a half years in the job but has re-emerged as an advisor to the Clerk of the Privy Council. Based on her experience as CIO she observed that “We have a significant level of technical debt that in some cases is decades in the making.”
Similar conclusions were reached by the Auditor General in a 2023 Report on Modernizing Information Technology Systems. Quoting from the Report: “It has been more than 24 years since the government first identified ageing systems as a significant issue and…still does not have a strategy to drive modernization. Only 38% of the government’s approximately 7,500 information technology applications were considered healthy…about one-third out of the 1,480 applications designated as mission-critical…were still considered in poor health…Many ageing systems are currently being maintained on old and outdated infrastructure, which is costly, resource intensive, and unsustainable.”
Among the many factors that have contributed to this sorry state of affairs, Michael Wernick, a former Clerk, observed that the government has never resolved how technology should be managed. Is it a single service with common standards, interoperability and cybersecurity? Or is it a loose federation of 300 departments and agencies where deputy heads and managers have autonomy? It now operates with both philosophies, depending on the agency.
It is well beyond the scope of this paper to suggest what the government needs to do to finally resolve its decades-long digital technology conundrum, a challenge that can only become more urgent with the emergence of powerful artificial intelligence. Fortunately, there is no shortage of advice from those with long experience in the way government works, as well as from those with deep understanding of what is required to implement digital technology in large organizations.
Conclusion
Returning to the question animating this paper—Is the federal public service too big?—we should set aside questions related to the role of government in society—should it play a bigger or smaller role? That is a political decision, although with obvious implications for the size of the public service. But quite apart from any political stance regarding the scope and ambition of government, there remains the technocratic challenge of achieving the program of the government of the day, whatever its ideological orientation, as efficiently as possible. To the extent that headcount exceeds what is needed to accomplish the task, one can conclude that the public service is too big.
Of course, in the real world it is not possible to “calculate” the minimum efficient size of the public service. Moreover the efficient size, prospectively, will depend on certain political decisions. If a government opts for excessively complex rules to govern its programs, or if it fails to invest adequately in technology to enhance productivity, then the size of the public service—even if otherwise well controlled—will be larger than would be needed in the presence of less complex program design and greater investment in technology. From this perspective, the public service may be judged to be too big, but the responsibility for that state of affairs would rest with government’s political preferences regarding program design and technology implementation.
So, there are two separate dimensions regarding the question as to the right size of the public service which I have labeled Tactical and Strategic:
- The Tactical dimension: Given the program design and technology implementation already in place, are there more public servants than reasonably needed to execute the government’s program?
- The Strategic dimension: Have the government’s choices regarding program design and technology implementation necessitated a larger public service than would otherwise be needed to execute the government’s program?
Along the Tactical dimension, there is an inherent tendency of large public bureaucracies to overstaff, subject to countervailing fiscal pressure. That pressure, until very recently, has not been a potent constraint so it would be expected that headcount has inflated cumulatively. On top of that, the COVID emergency likely led to some hiring that is now being unwound more slowly than strictly necessary.
Along the Strategic dimension, it is clear that the government’s decisions—e.g., requiring increasingly complex program criteria and eligibility rules, and the failure to upgrade or even maintain information technology—have required a lot of hiring just to cope. The findings of the Auditor General regarding the state of the government’s digital capacity and the experience of senior managers provide compelling evidence. The fact that inflation-adjusted program spending per employee was the same in 2022-23 as in 2016-17 suggests that the government’s program suite is too labour-intensive—e.g., due to overly complex rules and out-dated information technology. These are conditions that can and should be corrected. Until they are, one can say that the public service is too big.
 It is not possible (at least in this paper) to quantify the scale of the Tactical and Strategic effects on the size of the public service. But consider that in 2023 the number of federal public servants per 1,000 population was the highest in at least 40 years. That alone isn’t proof that the public service is now too big. But it raises the questions addressed in this paper which, on the balance of evidence, have led me to conclude that the federal public service has in fact become too big.
ANNEX A: PUBLIC SECTOR EMPLOYMENT TRENDS—HARPER AND TRUDEAU
The analysis that follows is based on employment numbers for about 60 departments and agencies covering 98% of total federal public service employment as reported on the Treasury Board Secretariat website. To facilitate interpretation, the individual entities have been informally grouped into related domains, 15 in total—e.g., Natural Resources; Economic Development; Culture & Heritage (see table on the next page). The information is summarized below and in more detailed graphical form in Annex B.[16]
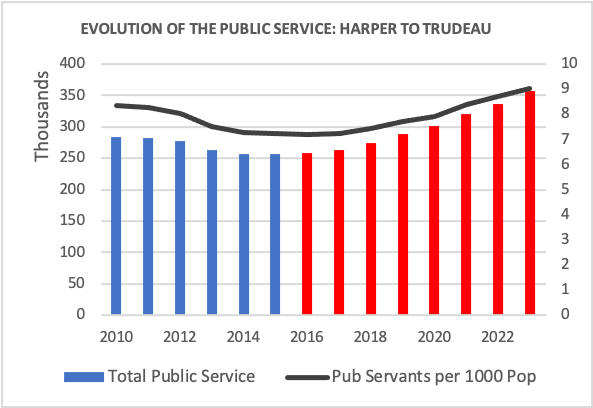 Between 2010 and 2015 the Harper government reduced public service headcount by a total of 32,000 in 80% of the departments and agencies analyzed here. Eleven organizations bucked the trend and added about 6,500 employees but 5,300 of those were in Shared Services Canada, newly staffed in 2012.
While the Trudeau government strongly reversed the overall trend of the previous five years, there has been far more growth impetus in some areas than in others. The employment trends portray perhaps the clearest indicators of the political philosophy of both the Haper and Trudeau governments.
Following are several tables that summarize the main features of the headcount data. These cover:
- The most significant Harper cuts in terms of absolute net staff reductions.
- The most significant increases under Trudeau in terms of absolute net staff additions.
- The departments and agencies for which staff complements have not been fully restored under Trudeau—i.e,. where employment in 2023 is less than in 2010.
- Three tables summarizing the aggregate data.
It is beyond the scope of this paper to investigate the specific factors responsible for the tabulated increases or decreases. The data simply raise questions to be answered. Some insight may be gleaned from the annual departmental plans but these apply an optimistic gloss. Deeper interpretation would require interviews with senior officials and political staff.

 In terms of absolute headcount reductions, the Harper government’s cuts were concentrated in nine departments and agencies. Those tabulated opposite each saw cuts of more than 1,000 and account for 20,400 of reductions, or 80% of the total employment cuts between 2010 and 2015. The 25% reduction in Agriculture & Agri-Food is particularly noteworthy.
 The Trudeau government’s major employment increases (defined here as those adding more than 1,000) affected 19 departments and agencies. These increases totalled more than 85,000 net new employees and constituted 87% of the additions between 2015 and 2023. In addition to major increases in CRA, up 47%, and the Public Health Agency, up 93%—each influenced by COVID)—the government’s focus on social policy, indigenous reconciliation, and immigration is evident in the tabulated summary. Several of the significant increases also represented restoration of deep cuts during the Harper regime—e.g., in National Defence (civilian), Fisheries & Oceans, Industry (ISED), Procurement.
 The Harper cuts have not been restored in every case. The table opposite covers all organizations where headcount in 2023 was actually lower than in 2010. Among major departments, Agriculture & Agri-Food and Health Canada remain below their employee levels 13 years ago. Two original Regional Agencies—ACOA and CEDQ—remain almost 20% below staffing levels in 2010. The Heritage & Culture portfolio, with the exception of Parks Canada, appears also to have been a low priority both for Harper and Trudeau. Particularly significant, and puzzling, is the fact that two agencies dedicated to public service staffing and management training—the Public Service Commission and the School of Public Service—are still below the employee levels of more than a decade ago despite growth of almost 40% in the public service since 2015.
The following three tables summarize the changes under Harper and Trudeau and their combined effects over the entire 13-year period, 2010-23. They are ordered by percentage change from greatest to least.
 During the final five years of the Harper government, net headcount was reduced by more than 25,000 or almost 10%, with only two of the 15 groupings used in this analysis showing an increase. (The growth of Internal Services reflects the creation of Shared Services Canada in 2011.) The only meaningful growth over the 2010-15 period, other than in Shared Services, was an increase of 416 (24%) in the Communications Security Establishment; 111 (13%) in the Public Prosecution Service; and 187 (3%) in the civilian staff of the RCMP. There were also some minor increases in several regulatory bodies. These small increments were significant only to the extent that they went against the trend and therefore signal the importance the Harper government attached to a law-and-order theme.
The priorities of the Trudeau government, and the effect of the pandemic, stand out in the large increases tabulated below which totalled nearly 100,000 net additions since 2015. Despite this, there were some groupings for which the Trudeau increases still left headcounts barely above the levels in 2010—e.g., the seven groups with increases of 12% or less between 2010 and 2023.
 |  |
ANNEX B: CHARTING THE EVOLUTION OF PUBLIC SERVICE EMPLOYMENT: 2010-23
The following series of charts—with brief commentary to emphasize certain aspects—depict the evolution of public service employment from 2010 through 2023.[17] The order of presentation reflects roughly the extent to which Trudeau’s priorities have differed from Harper’s.
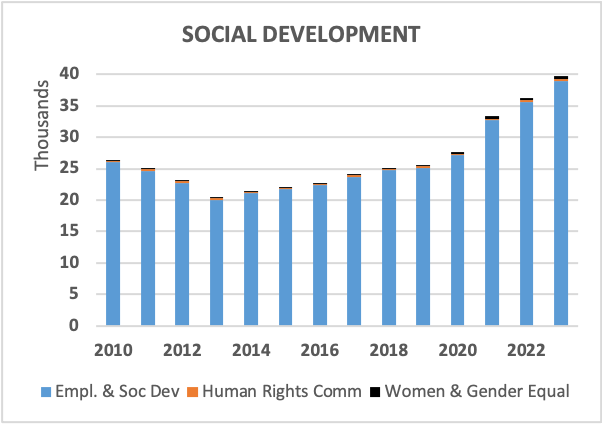 Employment and Social Development: This group comprises the Department of Employment & Social Development (ESD) which itself encompasses several ministries; the Human Rights Commission (HRC); and Women & Gender Equality. Between 2015 and 2023, employment in ESD increased by 17,300 (80%), more than twice the percentage growth in total public service employment. Over the full survey period since 2010 employment in ESD has increased by 50% versus 26% for the public service as a whole. The department is the primary agent of the government responsible for transfers to persons. It consequently bears a heavy load in terms of managing an expanding and ever more complex array of social programs. The effect of COVID can be seen in the large staff growth in 2021. The HRC and Women & Gender Equality (WGE) have small staffs (300 and 470 respectively in 2023) but have grown rapidly since 2015—the HRC by just under 50%, and WGE by almost 310%.
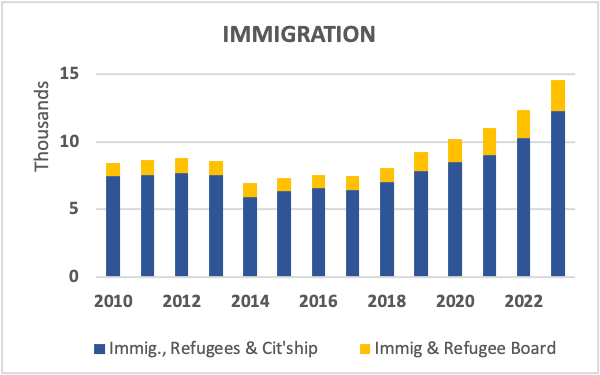 Immigration, Refugees and Citizenship: The Trudeau government’s commitment to increased immigration and refugee settlement is clear in this chart. The portfolio has added more than 7,200 staff since 2015, an increase of just under 100%. The Immigration and Refugee Board has increased 112% in the past five years. The headcount growth reflects, at least in part, the labour-intensive nature of immigrant and refugee processing.
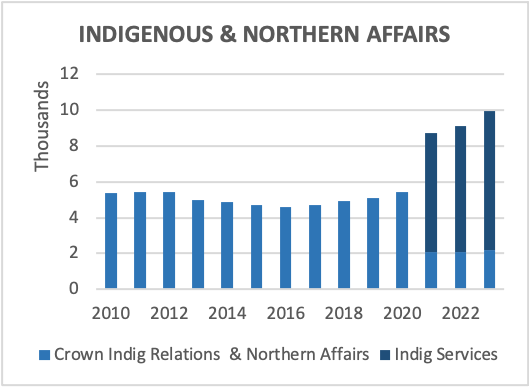 Indigenous & Northern Affairs: Combined in this chart is employment in (a) Crown-Indigenous Relations and Northern Affairs and (b) Indigenous Services, which together replaced the former Department of Indian Affairs and Northern Development. Headcount has increased by almost 5,300 (112%) since 2015, and by 83% in just the past three years, reflecting the extraordinarily high priority the government has assigned to Indigenous reconciliation. Spending increased from $21.7B in FY2020-21 to $37.5B in 2022-23, and a projected $48.7B in 2023-24, which reflect very significant amounts arising from several legal settlements.
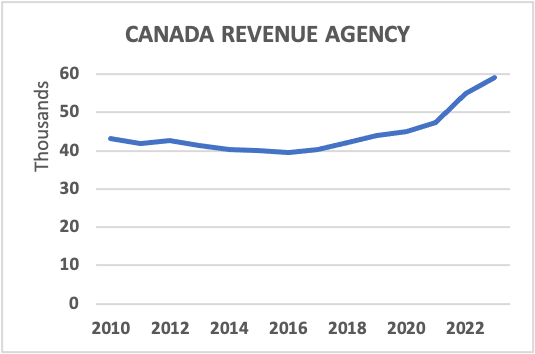 Canada Revenue Agency: The CRA headcount has grown by 19,000 (47%) since 2015—the largest absolute increase among departments. There was a particularly sharp 31% increase since 2020 to cope with COVID-related temporary transfer programs and more recently to administer the carbon tax rebate program. But employment was also growing steadily between 2015 and 2020 after having declined slightly during the last five Harper years. Automation could be expected to reduce headcount. The more routine encounters with CRA (e.g., by telephone) rarely permit human contact and written communication is typically by indecipherable form letters. The automation savings are perhaps being offset by the increasing complexity of the tax code and the labour-intensive auditing burden this creates, as well as other programs like CAIP that CRA is called on to administer. Nevertheless, there is probably no area of government more amenable than CRA to productivity increases through use of sophisticated IT processes.
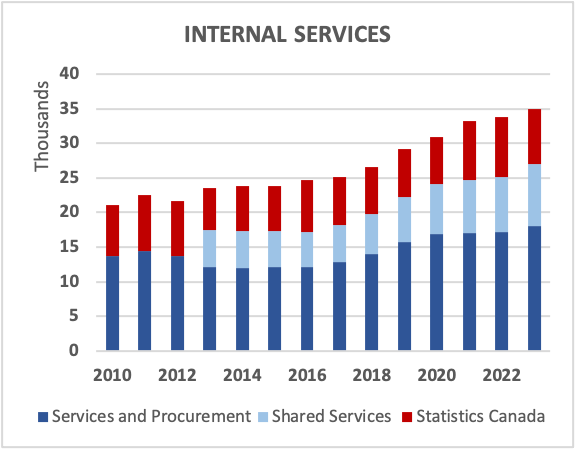 Internal Services: The former Public Works and Government Services was reorganized and expanded in 2013 following the creation of Shared Services Canada in 2011, a unit charged with providing a range of common services across departments, particularly via standardized infotech protocols. The three agencies grouped in the chart have seen headcount grow by 11,100 (47%) since 2015, led by Government Services & Procurement—up 6,000 (50%)—followed by Shared Services—up 3,600 (70%)—while StatCan increased moderately by 1,400 (22%) since 2015, and actually declined by more than 8% in 2023 reflecting a periodic variation associated with the Census.[18] StatCan employment is below where it was in 2011. This appears to be at odds with the contemporary emphasis on “big data” and far more intensive statistical analysis of economic and social phenomena and related policy.
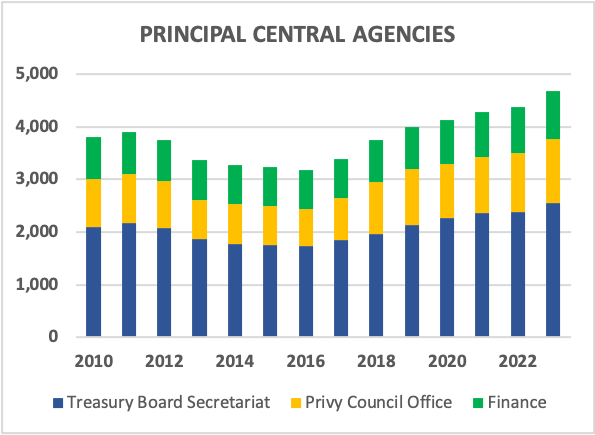 Principal Central Agencies: These are taken to be the Privy Council Office (the Prime Minister’s “department”); Finance Canada; and the Treasury Board Secretariat. Total headcount has rebounded strongly under Prime Minister Trudeau—up more than 1,400 (45%) since 2015 with a particularly large increase in PCO—up 485 employees (67%). Comparing 2023 with 2010, PCO is up 34%; TBS 22%; while Finance has grown only 13%. The robust increase in PCO reveals the continuing centralization of authority under Prime Minister Trudeau.
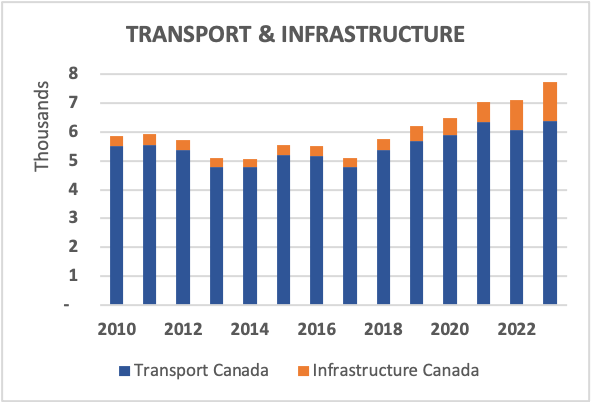 Transport & Infrastructure: This group was largely spared the Harper cuts but has increased significantly since 2015—up 2,150 staff (39%)—matching the percentage growth of the overall public service under Prime Minister Trudeau. Transport Canada has added 1,160 employees (22%), while Infrastructure Canada increased by just under 1,000, a growth of more than 280%.
The foregoing charts cover the principal areas of significant increase during the Trudeau administration, demonstrating the high priority accorded to social and Indigenous programs and policy; immigration; internal government services (including CRA); and public infrastructure.
Nevertheless, there are other important domains of public responsibility which have been accorded less priority in relative terms since 2015. In some areas headcounts in 2023 were little changed from 2010. These are illustrated in the following charts.
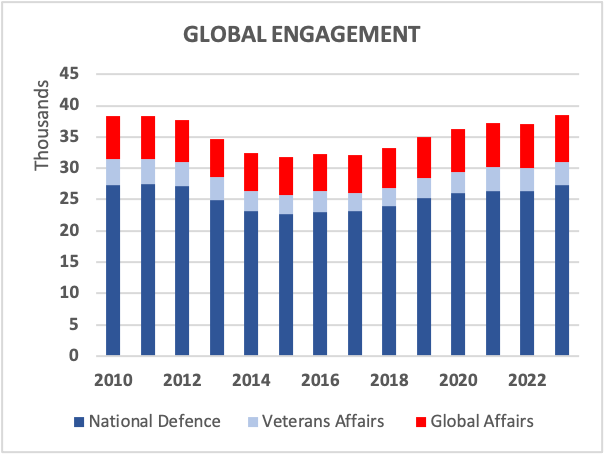 Global Engagement: This grouping comprises Global Affairs Canada, the civilian employees of National Defence, and Veterans Affairs. Headcount in 2023 was up by 6,700 (21%) over 2015 but this only brought employment back to the 2012 level. The headcount in Global Affairs Canada increased by 1,500 (25%) since 2015, bringing it back to slightly more than the level in 2012. Meanwhile, the DND civilian staff (27,400 in 2023) was the essentially the same as in 2012. By the metric of employment, Canada has not made a significant effort to increase its profile on the world stage.
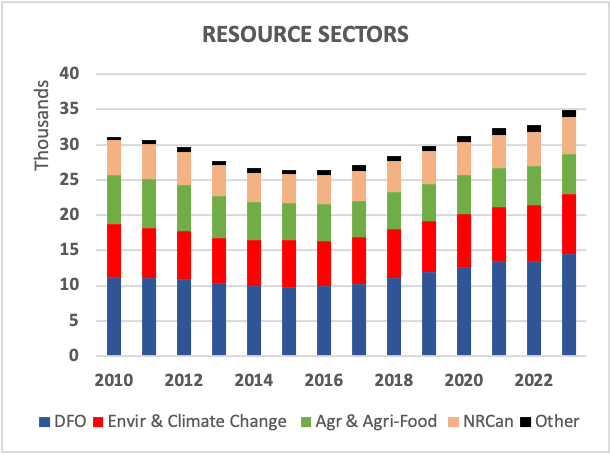 Natural Resources Sectors: This group includes Fisheries & Oceans (DFO); Agriculture & Agri-Food; Natural Resources (NRCan); Environment & Climate Change; and a small “Other” category comprising the Canada Energy Regulator and the Impact Assessment Agency. Overall headcount increased by about 8,500 (32%) between 2015 and 2023, with substantial growth in DFO—up 4,700 (47%). Environment & Climate Change increased by 1,800, a relatively modest 28% increase relative to 39% for the public service as a whole. NRCan also increased by 28%, whereas Agriculture & Agri-Food grew by a mere 9% (480 employees). In fact, in 2023, Agriculture & Agri-Food had 1,300 fewer employees than in 2012, a decline of more than 18%. Compared with the 2010-12 period, there has been relatively strong growth in the regulatory-oriented functions (DFO, ECCC, Impact Assessment and energy regulation) and little or no growth in the more economically-oriented departments (A&AF and NRCan). In view of Canada’s exceptional mineral and agricultural resources, and the implications of global demand and climate change for these industries, one would have expected a greater effort to build the government’s economic and scientific expertise and policy capacity in the strategically critical areas.
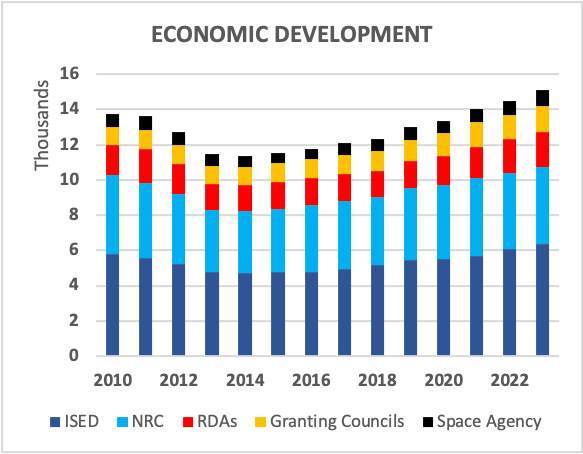 Economic Development: This group comprises the Department of Innovation, Science and Economic Development (ISED); the National Research Council (NRC); the Regional Economic Development Agencies (RDAs); the Research Granting Councils (NSERC, CIHR, SSHRC); and the Space Agency. The portfolio headcount grew by a little more than 3,500 (31%) between 2015 and 2023; less in percentage terms than the public service as a whole (39%). The lead department, ISED, increased by 1,600 employees (34%) while NRC (which includes the growing Industrial Research Assistance Program, IRAP) was up only 22%. In fact, NRC’s headcount in 2010 was slightly greater than in 2023. By contrast, employment in the academic research Granting Councils held steady in the face of the Harper cuts (2010-15) and has since increased 41% to 1,500 in 2023.
The Regional Development Agencies reflect a diverse experience. Their collective headcount increased 28% (430 employees) between 2015 and 2023. But RDA total employment remains a mere 3% above its level 13 years ago. In 2010, the Atlantic Canada Opportunities Agency (ACOA) employed 766. Headcount fell to 604 by 2015 but has increased only to 623 in 2023, still 19% below the level in 2010. The Quebec Agency has seen a comparable decline from 453 in 2010 to 370 in 2023, a drop of 18%. The Harper government cut the Western Agency (WED) by 42% between 2010 and 2015, but under Trudeau headcount has been restored to about the 2010 level. Two new Agencies have been created since 2010—one for southern Ontario in 2011, and a second (the Canadian Northern Economic Development Agency) in 2015. Since then, their combined headcount has grown 50% (to 440). The diverse trajectories of the five regional Agencies reflect political considerations, overlain by what appears to be diminished federal priority for regionally-segmented economic development.
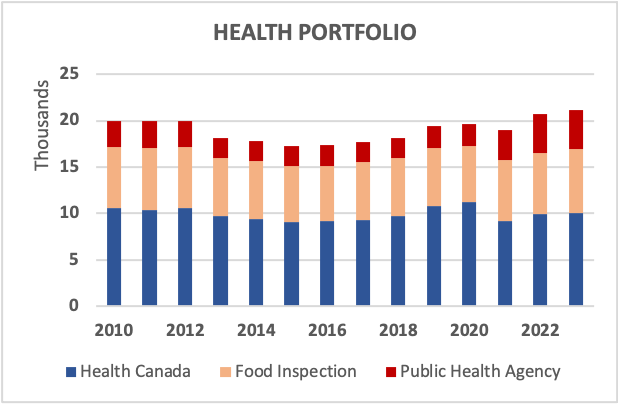 Health Portfolio: This group comprises Health Canada; the Public Health Agency (PHAC); and the Food Inspection Agency (CFIA). Headcount increased by 3,900 (22%) between 2015 and 2023 thanks primarily to a COVID-induced increase of 92% in the Public Heath Agency. PHAC employment languished during the early Trudeau years and in 2020 was 16% below the level 10 years earlier. Employment in the lead department, Health Canada, has also seen no overall growth in headcount for the past 13 years.
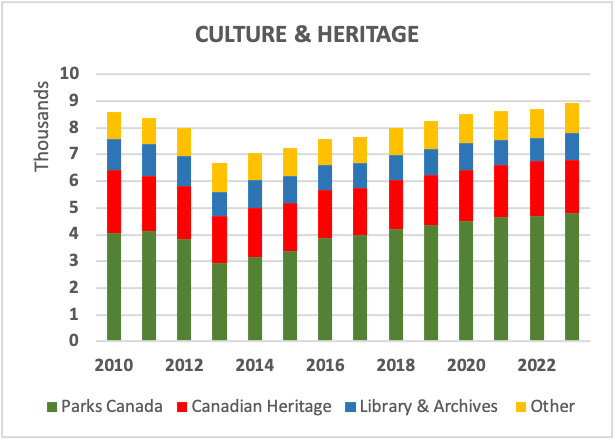 Culture & Heritage: This diverse group comprises Canadian Heritage; Parks Canada; Library & Archives; and an “Other” category including the National Film Board, CRTC, and Official Languages. The portfolio was cut deeply by the Harper government—down 22% between 2010 and 2013—and has since been rebuilt to slightly more than the headcount in 2010. The growth since 2015 has been primarily in Parks Canada where employment has increased by 1,400 (42%). By contrast, headcount in Canadian Heritage and in Libraries & Archives was lower in 2023 than in 2010. In the Other category, employment has fallen slightly since 2015 in both the Film Board and Official Languages, while increasing by 22% in the CRTC. With the exception of Parks Canada, neither the Harper nor the Trudeau governments have attached much priority to culture and heritage at least as measured by internal staff resources.
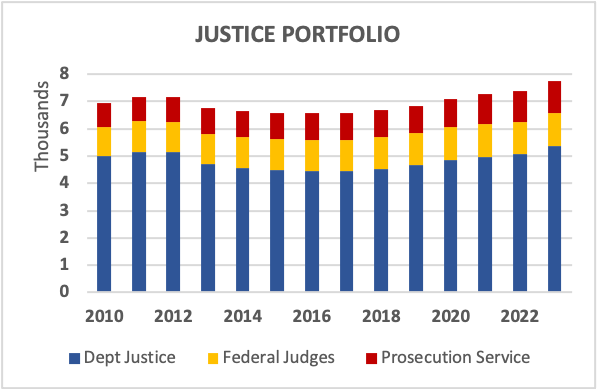 Justice Portfolio: This group comprises the Department of Justice; Federal Judges; and the Prosecution Service. Between 2010 and 2015 the Harper government increased headcount in both the Public Prosecution Service (13%) and Federal Judges (5%) while cutting the Department by more than 10%. Since then, the Trudeau government has increased departmental employment by 900 (20%), the Prosecution Service by 200 (21%), and Federal Judges only marginally (3%). The overall portfolio is up 17% since 2015 and a little more than 11% since 2010. But given frequent complaints about the inadequate number of judges, it is odd that there has been very little increase in their number over the past eight years.
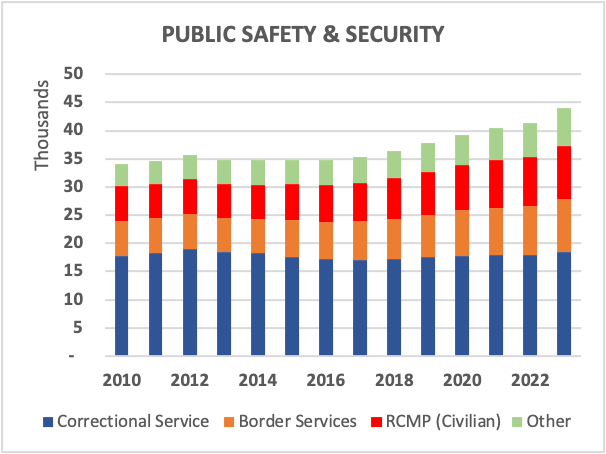 Public Safety & Security: This heterogeneous grouping was spared cuts by the Harper government and in fact grew very slightly between 2010 and 2015.Since then, headcount has increased by about 8,600 (20%). Correctional Services has remained almost flat, and in fact was slightly lower in 2023 than 2012. The Border Services Agency has added 2,400 employees (17%), almost all since 2019, presumably in the context of COVID and renewed travel. Significant growth—almost 3,000 (46%) occurred in the RCMP civilian staff. The “Other” category added 2,400 employees since 2015, up 56%, comprising Public Safety Canada (up 66%); Superintendent of Financial Institutions (63%); Financial Transactions Analysis (54%); Communications Security Establishment (46%); and the Financial Consumer Agency (up dramatically by 154%). Some of these increases are presumably in response to the increasing sophistication of cyber-empowered domestic and international crime, sometimes perpetrated by state actors.
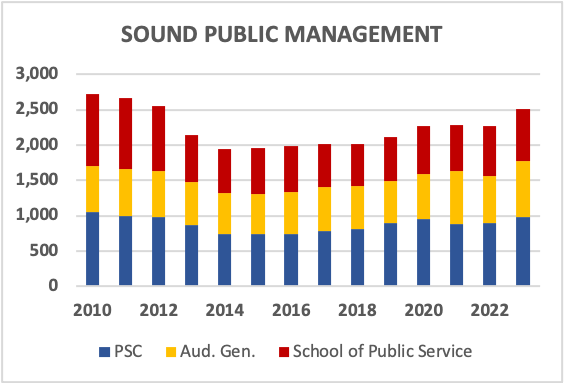 Sound Public Management: This group is taken to ecompass the Public Service Commission (PSC); the Auditor General; and the Canada School of Public Service (a “staff academy”). Headcount was reduced almost 800 (28%) between 2010 and 2015, with the School of Public Service particularly hard hit—down 36%. The Trudeau government increased the portfolio total by 28% since 2015, but headcount is still less than in 2010. While the Auditor General’s staff is up 22% since 2010, the PSC is down 7% and the School of Public Service is down 27% . Perhaps some of the latter’s function has been effectively delivered by technology or outsourced. On the face of it, it is quite shocking that the exceptionally rapid growth of the federal public service has been accompanied by stagnant growth in the two agencies whose principal responsibility is to ensure the quality, training and management skill of the public service.[19]
ANNEX C: PUBLIC SERVICE EMPLOYMENT 2010-2023

[1] The source for all employment data after 2010 in this paper is the Treasury Board Secretariat employment database. Here, the “public service” consists of employees of federal departments and agencies listed in the various schedules of the Financial Administration Act. The data exclude political staff, members of the Canadian Forces and RCMP, as well as employees of more than 30 Crown Corporations such as Canada Post, the CBC, the Bank of Canada, etc. The detailed employment data cover the period from March 31, 2010 through March 31, 2023—reported here on a calendar-year basis—and are broken down by departments and agencies. The referenced employment numbers are lower than those encompassed in the Personal Expenditure Analysis of the Parliamentary Budget Office which includes the non-civilian members of the Canadian Forces and RCMP. The PBO headcount in 2021-22 (413,000) is about 80,000 greater than the number in the Treasury Board Secretariat’s database.
[2] Reported compensation numbers, which include pension payments, vary according to the definition of precisely what is included. For example, the Public Accounts documents report compensation of $57.7B in 2019-20 and $63.3B in 2021-22. There also are usually subsequent adjustments to originally reported figures. Nevertheless, the trends tend to be insensitive to these issues.
[3] It has been estimated that external contracting totalled $15B in FY2021-22 of which $4.6B was for IT projects.
[4] Neoliberalism is a political-economic philosophy, often associated with Margaret Thatcher and Ronald Reagan, which sought to reduce the regulatory and redistributive role of the State and give greater freedom to market forces, both domestically and internationally. Policy consequences of what has also been called the “Washington consensus” included liberalized trade, tax cuts, privatization of public sector businesses, and various curbs on the growth of government, all of which featured in Canadian government policy until relatively recently.
[5] With so many priorities, nothing is a priority; instead many in the laundry list of commitments become distractions.
[6] Economists and national statistical agencies define labour productivity growth as the annual rate of change of (real) GDP per hour worked in an economy. A more general concept—Total Factor Productivity (TFP)—seeks to measure output per a combined unit of all relevant inputs, typically quality-adjusted labour and capital. When constructing the GDP, the value of the output of the Public Administration sector is calculated as the cost of inputs—salaries and capital inputs—and thus TFP is by definition “1” and is unchanging, although labour productivity by itself might increase.
[7] According to 2023-24 Departmental Plans, the planned spending of the Public Service Commission (PSC) in 2024-25 ($90.1M) is lower than actual spending in 2020-21 ($93.6M). For the School of Public Service (SPS), planned 2024-25 spending ($79.4M) is also less than the $ 82.3M in 2020-21. Headcount in both the PSC and SPS is below the levels in 2010.
[8] Program spending other than transfer payments—i.e., the cost of running the government—actually increased between FY 2020-21 and 2022-23, reflecting higher compensation cost associated with the sharp increase in public service headcount.
[9] Real program spending is current dollar spending deflated by the price index for government consumption spending with 2017 = 100 (StatCan Table 36-10-0223-01). This choice of deflator is somewhat arbitrary since most federal program spending is in the form of transfer payments to governments, individuals and organizations. But use of a different deflator (e.g., personal consumption) does not change the qualitative trend.
[10] To put this in context, over the 34-year period, 1983-2017, real spending per public servant increased 60%, an average of almost 1.4% per year.
[11] For example, ESDC plans on a headcount reduction of 9,000 (27%) between 2022-23 and 2025-26 while planned gross spending (in current dollars) increases 17% resulting in a very large prospective growth in spending per employee. CRA plans an employee reduction of 6,800 (12.6%) between 2022-23 and 2025-26 while planned spending increases 29%, primarily driven by the anticipated growth of the carbon tax rebate (CAIP). Meanwhile, about 80% of CRA headcount is associated with tax administration. Spending on tax (2022-23 through 2025-26) is planned to decrease 17% while related headcount would fall by only 10%, implying a 7.8% decline in spending per employee—i.e., falling productivity in this key sector of CRA’s responsibility.
[12] In 2015-16, Major Transfers to Persons (OAS, child benefits, EI) were $83 B and Oher Transfers (to individuals and groups, but not to governments) were $35 B, for a total of $118 B. In 2022-23 these had grown to $112 B and $106 B respectively for a total of $218 B, an increase of 85%. By 2022-23, the extraordinary COVID transfers to individuals had ended (but the carbon tax rebate is included–$7 B in 2022-23). So, the 85% increase is not distorted by the COVID transfers. (Source: Fiscal Reference Tables)
[13] By contrast, transfers to other governments ($91 B in 2022-23) are largely formula-driven and involve very large individual amounts. The number of employees required to deliver these transfers, as a ratio of the sums involved, is close to zero. In this case, spending per employee, while extremely high, is not a meaningful indicator of productivity.
[14] “If we can’t do the process of simplification, tech is not going to fix the problem,” Chief Information Officer, Catherine Luelo, said in an interview. The Phoenix pay-system debacle is a perfect example of what happens when processes aren’t simplified. It began as project to integrate pay and human-resources systems. Seven years and $3.6 billion later, there is one pay system and still more than 30 separate HR systems, which is behind many of the problems. (Source)
[15] For several years, the government has been falling short of filling its 30,000 IT positions by up to 30 per cent. (Source)
[16] The adopted sub-groupings of departments and agencies are “unofficial”. Different collections could be used or preferred.
[17] Employment numbers are rounded to the nearest hundred, and percentage changes generally to the nearest whole number.
[18] Statistics Canada falls under the purview of the Minister of Industry, but in view of its relevance across the government—and across Canadian society—it is treated here as an internal service.
[19] According to the 2023-24 Departmental Plans, both planned spending and headcount for the School of Public Service will be flat ($79.4 M and 669 respectively) between 2023-24 and 2025-26. The Public Service Commission plans for a 6% reduction of spending ($95.9 M to $90.2 M) between 2022-23 and 2025-26 combined with a very small reduction of full-time-equivalent headcount (851 to 844).