By Peter Nicholson
This note summarizes and comments on key findings of the 2024 World Happiness Report (WHR), the latest in a series of annual publications that explore the nature and implications of a particular concept of “happiness” in a cross-nation comparative context. There should be much greater awareness of this exceptionally rich body of work and of its implications for public policy.
The WHR is published by the Wellbeing Research Centre at the University of Oxford in partnership with Gallup and the UN Sustainable Development Solutions Network. The genesis of the report, first published in 2012, owes much to UBC economics professor, John Helliwell who, along with Richard Layard of the London School of Economics, has championed the field of happiness studies as a complement to an exclusively economic focus on well-being. In the WHR, happiness is measured according to responses to a question on the annual Gallup World Poll which asks respondents to “evaluate their current life as a whole” on a scale of 1 to 10 from the worst to best possible for them. Throughout this paper, the term happiness will be used as shorthand for the results of Gallup’s life evaluation polling. National happiness rankings are based on the average of the polled responses within each country—see the top 25 below. The data are extensively analyzed in the WHR with respect to age and gender and various factors that are believed to influence the evaluation of one’s life—income, health, social support, freedom of choice, generosity, and perception of corruption.
The Happiest Countries: 2021-23
In the 2024 World Happiness Report, based on polling in 143 countries averaged over 2021-23, the top-ranked country is Finland (for the 7th year in a row), followed by Denmark, Iceland, Sweden, Israel, Netherlands, and Norway. Canada comes in 15th, but tops in the G-7. Although media reports invariably focus on a country’s rank order, it is more relevant to interpret the underlying metric on which the ranking is based—in this case, the average of life evaluation responses in each country. The range runs from Finland at 7.74 on a scale of 10 through Afghanistan at 1.72, with a median of 5.82. Canada’s happiness score, 6.90, is just under 90% of Finland’s and 2.6% above the US (6.73). The top twenty countries all fall within one point of each other and normal statistical variation creates significant uncertainty in precise ranking.
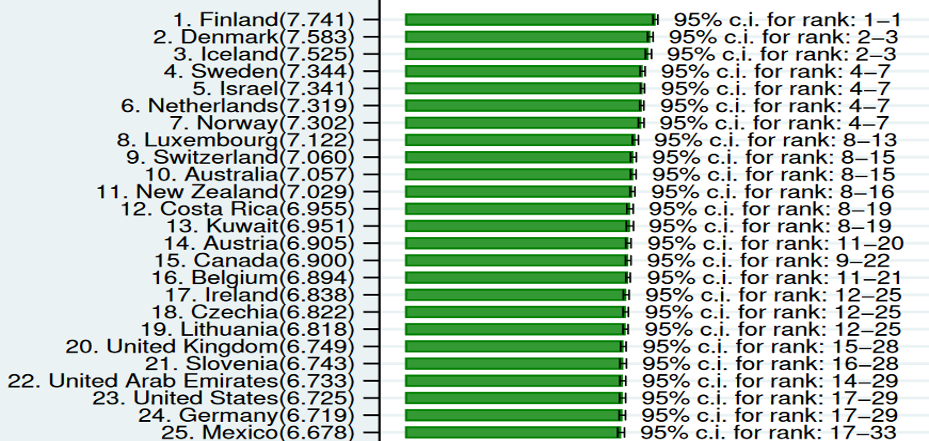
It is interesting that the top countries no longer include any of the largest countries. In the top ten, the Netherlands and Australia have populations over 15 million, and in the top twenty, only Canada and the UK have populations over 30 million.
The Trend of Happiness Scores
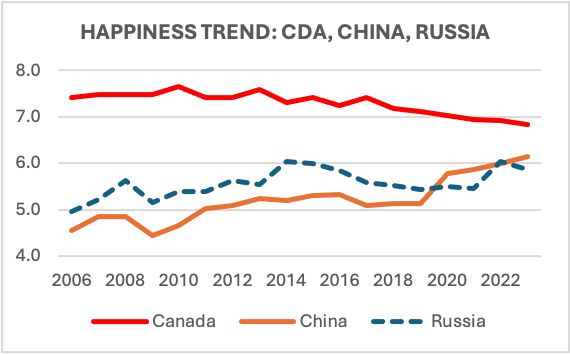
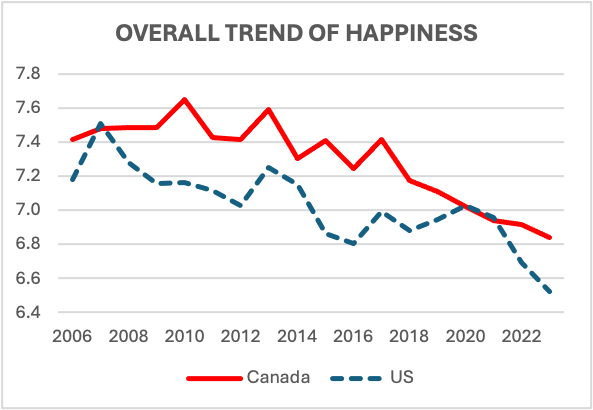
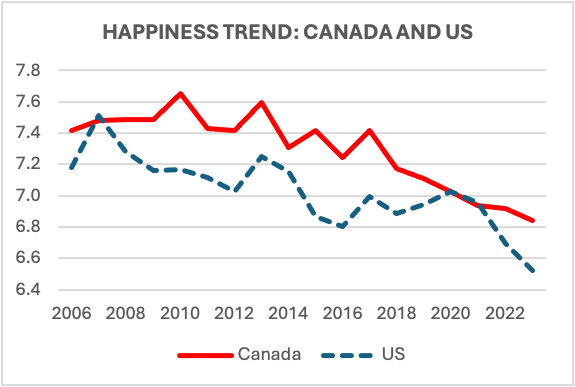 It is particularly revealing to follow the time trend of happiness. On a global average basis (with all countries weighted equally) there has been little change in happiness since 2006 notwithstanding the severe recession in 2008-09 and the pandemic. On the other hand, there has been significant movement among countries and regions. At right is the trend for Canada and the US from 2006 through 2023. The decline in life evaluation, on a 10-point scale, is seen in most of the developed countries, but not in many of the countries in Eastern Europe (including Russia), nor in China—see chart below. The contrasting slope of the happiness trends of Canada-US and China-Russia may shake some long-held assumptions regarding the relative merits of the West versus the rest.
 The young—those under 30—are particularly gloomy in much of the developed world while the over-60 cohort is comparatively upbeat. In Canada, the US, and Australia the oldest group is the happiest on average (see chart below). In both Canada and the US there is a progression in rated happiness across age cohorts with the youngest being the least happy; the lower-middle age (30-44) the second least happy; the upper-middle age (45-60) third least, and over-60s the happiest. Most developed countries do not show quite as pronounced an age trend as Canada and the US do, although, in the great majority, one of the two younger age cohorts (under 30 or 30-44) is the least happy while the over-60s are happiest.
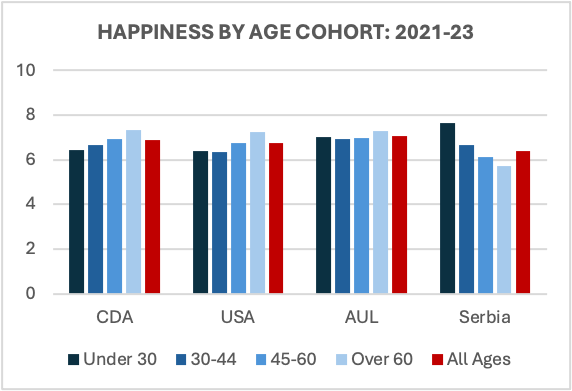 Precisely the opposite trend is seen in much of the middle-income world, and dramatically so in Eastern Europe. Serbia typifies the trend. There the average life evaluation of the under-30s ranks third in the world, a shade behind Lithuania at the top. Among the under-30s, Canada ranks 58th and the US 62nd out of 143 countries whereas among the over-60s, Canada ranks 8th and the US 10th.
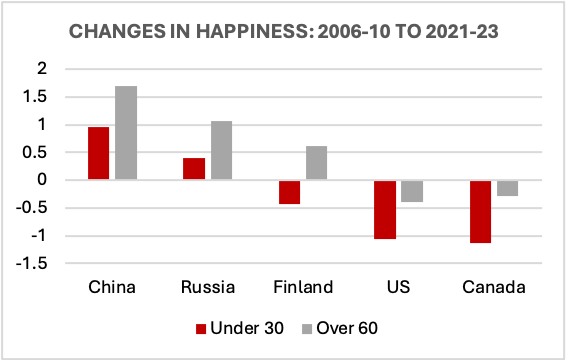 Both Canada and the US have experienced a significant decline in “happiness” across the age spectrum since 2006-10. They have trended in the opposite direction of, for example, China and Russia. The Canada and US declines have been especially precipitous among the under-30 cohort whose rated happiness has fallen by 1.1 points, among the largest reductions in the world. There has also been a decline in the over-60 cohort in Canada and the US, but far less. Meanwhile, the older cohort in China has experienced nearly the world’s largest increase in reported happiness over the past 15 years.
These trends may reflect the alienation with respect to the established institutional order felt by sub-populations in highly developed countries. The age pattern of subjective well-being in Canada and the US runs counter to well-established findings in the psychological literature that individual life satisfaction tends to be U-shaped with respect to age—i.e. happiness is relatively high in youth, declines through middle age, typically bottoming out between 45 and 55, and then increases with advancing age, notwithstanding a growing health burden.
The 2024 World Happiness Report’s snapshots of happiness across age cohorts also reflect “generational” effects. For example, the older cohorts in Eastern Europe continue to bear the scars of Soviet domination, and in the case of Serbia, of the genocidal conflict in the early 1990s; whereas younger Americans and Canadians may have been, to date, the most affected by negative psychological consequences of social media and by a sense of relatively diminished prospects as the rate of economic growth has weakened. (The 2024 World Happiness Report includes an extensive analysis of the under-30 age group.)
Accounting for the Variation in Happiness Across Countries
What factors might be responsible for the wide variation in reported happiness across countries? Based on survey research, and constrained by the availability of comparable data across a broad sample of countries, the WHR has identified six principal drivers:
- GDP per capita
- Social support—measured as the Yes/No (1/0) answer to the question as to whether you have friends you can count on for help when needed.
- Healthy life expectancy (in years)—data from WHO
- Freedom to make life choices—measured as the Yes/No (1/0) answer to the question of whether you are satisfied with your freedom to choose what to do with your life.
- Generosity—the extent to which residents of a country donate to a charity more or less frequently than the average for countries with similar per capita GDP.
- Perception of corruption—measured as the average of Yes/No (1/0) answers to two questions as to whether there is widespread corruption in (a) government and (b) business.
Note that four of the six factors are calculated as national averages of individual responses to polling questions—i.e., social support, freedom of choice, generosity, and perception of corruption. The other two, GDP per capita and life expectancy, are derived from national statistics and are not specific to the individuals in the polled sample.
Statistical regression analysis—based on pooled data across sampled countries from 2005 through 2023—is used to estimate the extent to which the foregoing variables, in combination, account for the observed happiness scores in every country.[1] The six factors account for about three-quarters of the variation in reported happiness across the full set of countries. There are of course other unmeasured factors, as well as some randomness, that prevent the six factors listed above from fully explaining any given country’s reported happiness.
It is also important to realize that this kind of statistical analysis can only uncover correlations between the happiness score and the six explanatory variables. It does not establish definitively that any or all of the variables actually caused the observed score. For example, while societies that express greater social support and generosity and that have longer healthy lives may be happier, it is also likely that having a happier population tends to produce a society that is more supportive, more generous, and more healthy. Moreover, certain of the explanatory factors are correlated with others—e.g., life expectancy is positively correlated with per capita GDP. So, while the factors are not entirely independent of one another, and their causal relation to happiness may run in both directions, they nevertheless provide useful insight as to why the populations of some countries are on average more or less happy than others. 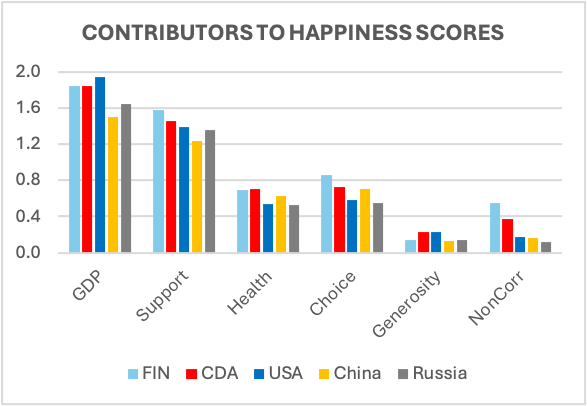 There is a huge academic and institutional literature—of which the series of WHRs form an important part—that probes deeply into the factors associated with well-being at both the individual and societal levels—e.g., here and here.
The chart opposite compares the respective contributions to happiness of the six identified factors for Finland, Canada, USA, China, and Russia, based on 2021-23 average data. (Note that the “corruption” variable actually measures the relative absence of corruption—i.e., a higher bar corresponds to a lower perception of corruption in the country. The size of the bar might also be interpreted as a measure of trust in the country’s institutions.) [2]
The relative order of the explanatory factors across the five countries is roughly what one might expect—e.g., per capita GDP makes the largest contribution to the US happiness metric but is significantly offset, relative to Finland and Canada, by a lower average score on social support (i.e. having someone you can count on when in need); on healthy life expectancy; on freedom to choose what to do with one’s life; and on perception of non-corruption. The happiness measures for China and Russia, 5.97 and 5.79 respectively, are closely separated but the contributing factors are quite different—e.g., Russia has a significantly higher GDP per capita and a greater sense of individual social support but a lower healthy life expectancy than China and less sense of freedom of choice as to what to do with one’s life. It is counter-intuitive that the US population, as polled, has a relatively low evaluation of freedom of choice regarding what to do with one’s life—lower than China and only slightly greater than the Russian average. In America—the Land of the Free—freedom tends to be interpreted in terms of expression of opinion, political activity, and economic institutions, whereas at the level of the individual, the felt freedom of choice may be mitigated by the social and cultural environment including racial and other forms of discrimination and inequality.
The time paths (2008-23) of each of the six explanatory factors for Canada and the US are found in Annex I of this paper.
2024 World Happiness Report: Some implications of the findings
A recent authoritative review of advances in well-being research began by stating that: “The empirical science of subjective well-being, popularly referred to as happiness or satisfaction, has grown enormously in the past decade. Higher subjective well-being has been associated with good health and longevity, better social relationships, work performance and creativity. National accounts of subjective well-being to help inform policy decisions at the community and societal levels are now being considered and adopted.”
The annual World Happiness Reports have nevertheless not achieved much traction in the public mind and have not come close to displacing economic metrics as an explicit subject for policy intervention. Partly that’s because the life evaluation (“happiness”) metrics are still unfamiliar. Moreover, and unsurprisingly, many conventional policy domains already address factors believed to underlie happiness. Economic policies seek to increase per capita GDP; a spectrum of social policies seek to fill gaps in an individual’s support network; health policies aim to improve healthy life span; education and anti-discrimination rules increase freedom to choose what to do with one’s life; tax incentives for charitable giving are designed to promote generosity; and legal sanctions together with institutional norms work to discourage corruption.
In effect, governments already have a spectrum of happiness policies even if they are not labeled as such. More can always be done. Perhaps regular high-profile publication of internationally comparable happiness metrics would create a “race to the top” and would certainly motivate a great deal of research and public debate about the nature and causes of well-being and the best policies to promote it. Well-being as an overarching objective is more appropriate than, say, economic growth which clearly is a means rather than an end in itself.
Still, there are reasons to be skeptical of adopting well-being or happiness as the North Star to guide policy. The various practical metrics that have been proposed all have conceptual and methodological weaknesses that so far have precluded consensus on the one best. Research indicates that there is a significant genetic influence on personality traits that predispose an individual toward happiness or its opposite and this effect would be outside the scope of policy intervention. On the other hand, while genetic factors undoubtedly influence one’s happiness “set point”, there are plenty of non-genetic influences that are amenable to policy intervention. Cultural differences may preclude a single globally appropriate happiness metric as well as agreement on a set of common factors that account for happiness across cultures. But every culture does have a concept of well-being and a sense of what contributes to its increase. The extensive data collection and analysis undertaken in producing the WHRs suggests a greater commonality across nations and cultures than might have been expected.
What is most significant and policy-relevant about the findings reported in the 2024 WHR is the time trend of happiness in the most affluent countries—and especially in the US and Canada—and the sharp age gradient in the trend with young people being the least happy. Contrast this with exactly the opposite trend in some other regions, notably Eastern and Central Europe. The latter may be understood in the light of relatively recent regional history but it is surprising that the positive happiness trend has persisted in the face of regional neighbour Ukraine’s catastrophe.[3]
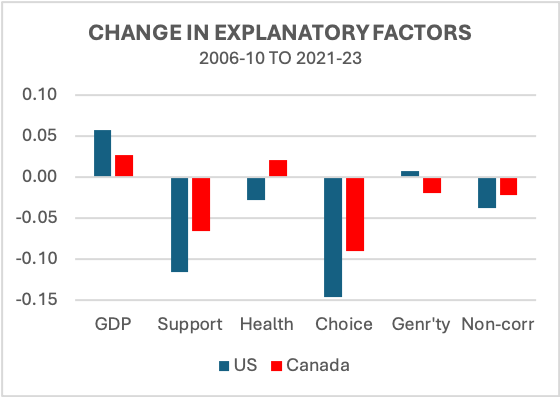 The happiness trend that is most ominous and challenging to explain is the overall decline in the most developed countries and the age profile of decreasing happiness. In the case of Canada and the US, while per capita GDP has increased between the 2006-10 period and 2021-23, the measure of social support (i.e., someone you can count on for help when needed), and freedom to choose what to do with your life have diminished sharply.[4] Perception of corruption has increased (producing the negative bars at the far end of the chart) which may signify declining trust in business and government. Remarkably, healthy life expectancy in the US has fallen, apparently due to the exceptional burden of COVID as well as unprecedented youth mortality due to an epidemic of drug overdose. The data in the chart are for the entire polling sample and would be expected to show even steeper declines for the under-30 cohort.
There is a broad instinctive awareness of the phenomena underlying the data assembled in the 2024 World Happiness Report. Nevertheless, the great value of the Report is to make the gut feeling quantitatively explicit, notwithstanding some remaining conceptual and methodological uncertainties. Something very significant is going on here, not only in Canada and the US, but to a varying extent across the affluent Western democracies. As the WHR demonstrates, this transcends idiosyncratic national factors and the local political drama that preoccupies the media. The WHR has demonstrated the need for deeper insight. To borrow a metaphor, the World Happiness Report is like the canary in a coal mine.
ANNEX I: FACTORS THAT CONTRIBUTE TO REPORTED HAPPINESS—CANADA VS US
Following are several charts that trace the evolution in Canada and the United States of the factors identified in the WHR as contributing to self-reported happiness. The data are taken from the statistical annex to the 2024 World Happiness Report.
 The charted data are the national averages of the annual responses to the question from the Gallup World Poll:
“Evaluate your current life as a whole using the image of a ladder with the best possible life for you as a 10 and the worst possible as a 0.”
Roughly a thousand respondents were sampled each year in both countries and responses were weighted to reflect the demographic make-up. The evaluations have generally declined—in Canada’s case from a high of 7.65 in 2010 to a low of 6.84 in 2023; and in the US from 7.51 in 2007, just before the Great Recession, to 6.52 in 2023. (The figures in the chart are yearly averages whereas the national numbers in the main WHR are three-year averages.)
Contributing Factors
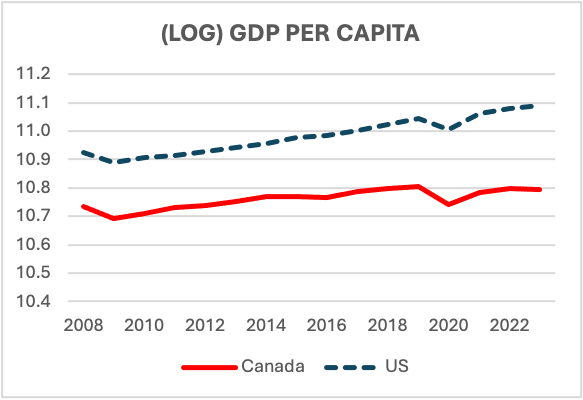 The per-person size of GDP has regularly been found to positively influence virtually all measures of well-being, including the WHR’s happiness metric. The WHR’s regression model uses the natural logarithm of per capita GDP (in constant international dollars at Purchasing Power Parity) and assigns a weight of 0.349 in estimating its contribution to reported national happiness. The US has an edge over Canada but GDP per capita has not fallen in either country (other than at the peak of COVID in 2020) although there has been no real per-person growth in Canada since 2018. Nevertheless, the trend of per capita GDP has not contributed—at least not directly—to the decline in happiness in either Canada or the US.
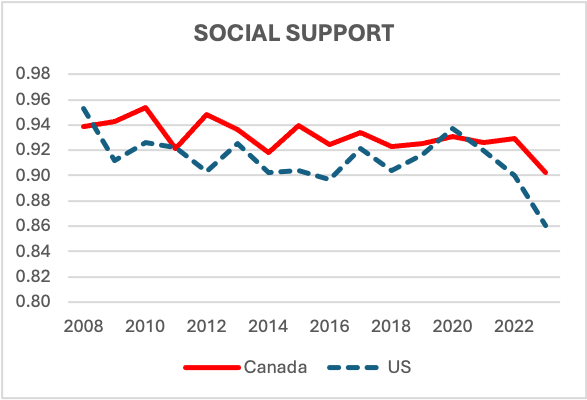 “Social Support” is defined as the national average of responses to the Gallup World Poll question: “If you were in trouble, do you have relatives or friends you can count on to help you?” A “Yes” is coded as 1 and “No” as 0. The average response has a weight of 2.563 in the WHR regression model. (Thus the average response of 0.94 in Canada in 2015 would have contributed an estimated 2.41 points to Canada’s happiness score of 7.41 in that year.)
Clearly the great majority in both Canada and the US believe they have at least one person they can count on—and note the local peak coinciding with COVID—but the overall trend has been one of decline and has contributed to the reduction of happiness in both countries.
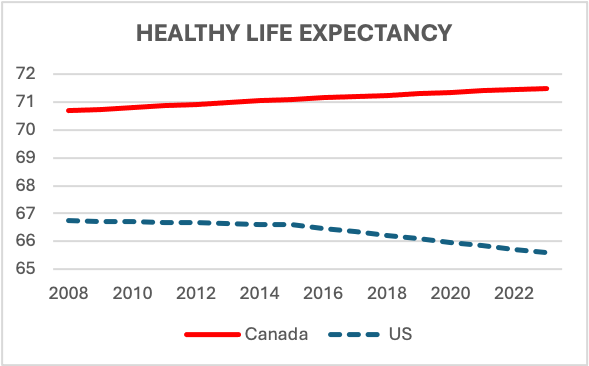 Healthy life expectancy (based on data from WHO) has diverged sharply between Canada and the US and has declined steadily in the United States since at least 2008, and warning signs were reported much earlier. This trend is unprecedented among affluent countries and is arguably the single greatest indictment of social policy and related conditions in the US. The sharp decline since 2015 antedates the effect of COVID and is believed by some to be due to a growing number of “deaths of despair” including an epidemic of drug-related mortality among the young. The burden of chronic disease is also especially heavy in the US and explains why American “healthy” life expectancy has fallen farther and earlier than life expectancy itself. The trend is all the more remarkable in the context of US expenditure (public and private) on healthcare which currently at 16.6% of GDP (compared with 11.8% in Canada) is a global outlier.
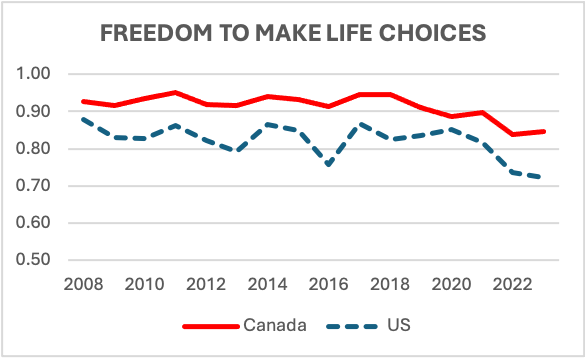 The variable: “Freedom to make life choices” is the national average response to the Gallup World Poll question: “Are you satisfied with your freedom to choose what you do with your life?” (Yes = 1; No = 0) Most respondents (80%-90%) report satisfactory freedom of choice but there is some indication of decline since 2017. Surprisingly, Canadians consistently rank their freedom of choice higher than the average American does. This may reflect a greater prevalence of discrimination or economic inequality in the US. (The Freedom variable carries a weight of 1.378 in the WHR’s regression model.)
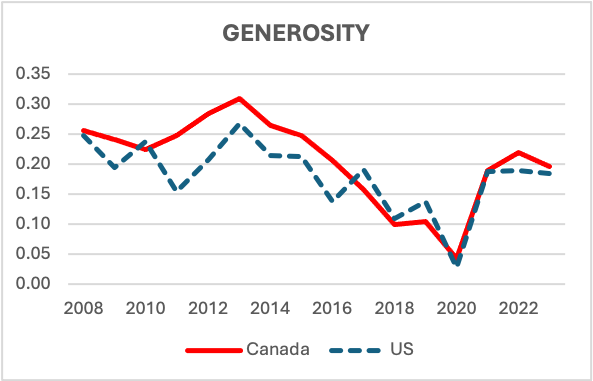 The Generosity variable begins with the question: “Have you donated money to a charity in the last month?”
The statistical measure seeks to correct for national income and is defined in the WHR as “the residual of regressing the national average of responses to the question on the log of national GDP per capita”. The Canada-US difference is insignificant. While both countries appear to have been becoming less generous, there has been a clear reversal in the wake of COVID, thus offsetting some of the negative effects of the pandemic (e.g. on GDP per capita). It remains to be seen if the recent recovery of generosity is sustained. (The weight of Generosity in the WHR regression is 0.487.)
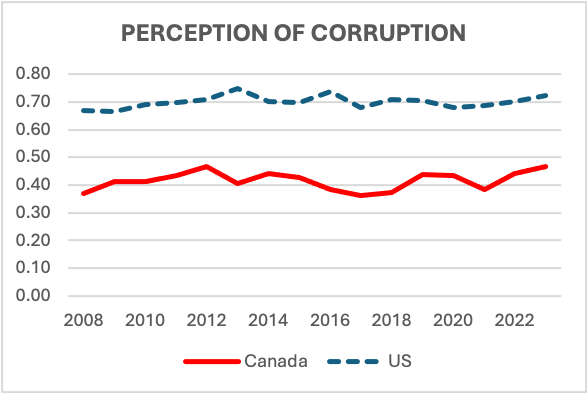 Perception of Corruption is the average of responses to two questions in the Gallup World Poll: “Is corruption widespread throughout government and is it widespread within business? If an individual’s answer is Yes in both cases, the variable registers as 2, and if No in both cases, then it is 0 and so forth. So higher values signify a greater perception of corruption—as is clearly the case in the US relative to Canada, although there is no clear time trend in either country. (The Corruption variable carries a negative weight of -0.733 in the WHR regression, consistent with a higher perception of corruption acting to diminish national happiness.)
ANNEX II: FREQUENCY OF POSITIVE AND NEGATIVE EMOTIONS: CANADAS VS US
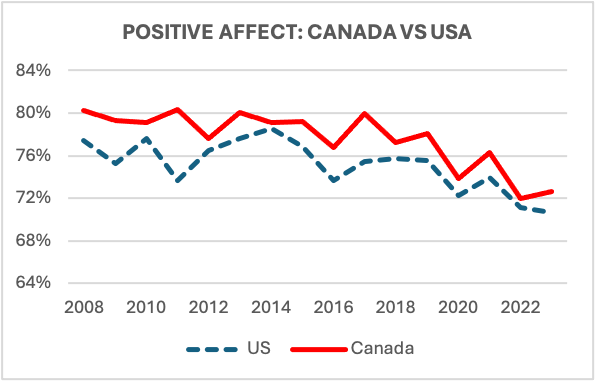 The Gallup World Poll also seeks to determine respondents’ emotional state in the here and now—what psychologists call “affect”, both positive and negative. Positive affect is measured by the answer to the question: “Did you experience the following feelings during a lot of the day yesterday: laughter, enjoyment, doing interesting things?” Negative affect is measured by the same question but with respect to feelings of worry, sadness, or anger.
The measurement of affect is generally correlated with the happiness measure (which focusses on the overall evaluation of one’s life) 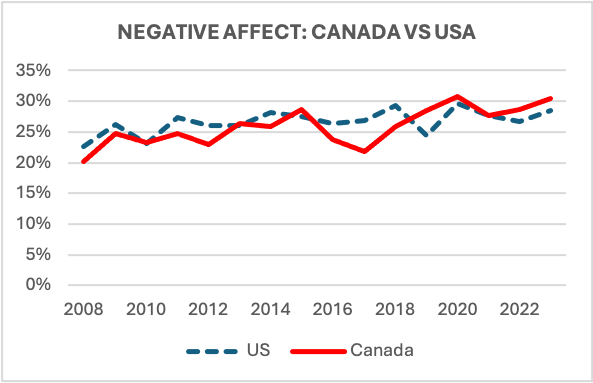 and it adds very little explanatory power beyond the six factors outlined in Annex I.
The charts show that in both Canada and the US the prevalence of positive affect has been declining quite sharply since 2014-16—from 75%-80% of the population to just over 70% in 2023. Put another way this suggests that roughly 35 million people in Canada and the US are experiencing fewer positive feelings than there was the case 6-8 years ago.
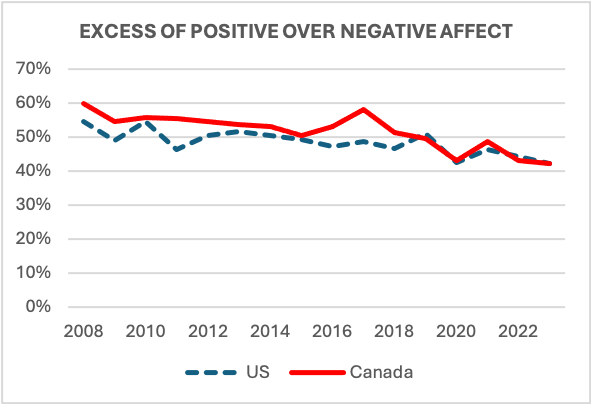 On the flip side, negative affect has been increasing steadily since 2008, up about 10 percentage points from 20% of the population to about 30% in 2023. The effect of COVID can be seen in reduced positive affect and increased negative affect in 2020, but the adverse trends antedated the pandemic and have continued since. The chart opposite shows the compound effect of declining positive and increasing negative affect—i.e., the difference between those reporting positive feelings and those reporting negative feelings “yesterday”. The balance is still positive, but the direction of the trend is anything but.
The WHR presents global data on the frequency of negative emotions—negative affect—and finds that, on the global average in 2021-23, negative affect increases with age and is also somewhat higher at all ages for women than for men. With respect to age gradient, Canada and the US run strongly counter to the global average and experience the greatest negative effect among the under-30 cohort, consistent with the similar age gradient for the happiness.
Negative affect has increased globally, and in almost all regions and age groups, since 2006-10 with the notable exception of Central and Eastern Europe where negative feelings have declined across all ages. Positive affect tends to be higher almost everywhere among the young and declines quite consistently with age. The global average of positive affect has increased slightly since 2006-10, although entirely in older age groups. However as shown on the previous charts, the prevalence of positive feelings has declined in Canada and the US, and this has been the case across the age spectrum. North America is also the only region in the world where positive affect among the under-30 group is no greater than among the over-60s.
The message in the trends of positive and negative affect in Canada and the US is essentially the same as for the overall happiness measure—headed in the wrong direction and particularly ominous for younger people. The trend cannot be explained away by appeal to short-term or local political and economic factors. Almost surely the roots are social and cultural with an effect that is differentiated by age, though visible across all ages.
[1] The regression analysis yields weights (coefficients) for each of the explanatory variables—0.349 for (the natural log of) GDP per capita; 2.563 for social support; 0.028 for life expectancy; 1.378 for freedom of choice; 0.487 for generosity; and -0.733 for the perception of corruption (higher corruption has a negative impact on happiness). The measured values of the six variables for each country are multiplied by the foregoing weights and then summed to determine their estimated contribution to that country’s happiness score. There is still a residual portion of the score that is not accounted for by the six variables.
[2] The decomposition shown in the chart accounts for the difference in happiness between a given country and a hypothetical country, labelled “Dystopia”, defined as having the lowest measured values of each of the six explanatory factors across the full set of 143 countries. The happiness score for a given country is the sum of the contributions of each of the six factors plus the estimated “happiness” of Dystopia (1.58) plus a residual. For example, in Canada’s case the six factors total 5.33. Adding Dystopia’s 1.58 gives a total of 6.91 versus the reported happiness score of 6.90. The “unexplained residual” for Canada is very small.
[3] Ukraine itself is not at all happy, ranking 106th with a score of 4.87, slightly below the State of Palestine at 104 and a score of 4.88. By contrast, Russia ranked 73rd (5.79) and Israel ranked 6th overall (7.34) well above Canada and the US. The 2023 poll in Israel was taken after the Oct 7 massacre but before the heavy engagement in Gaza. The poll in Palestine was earlier in 2023. Note as well that the happiness score is calculated as a 3-year average: 2021-23.
[4] The bars in the chart (derived from data in the 2024 World Happiness Report) are changes in the measured values of the variables multiplied by their weights in the regression model. (The underlying variable for GDP per capita is its natural logarithm.)